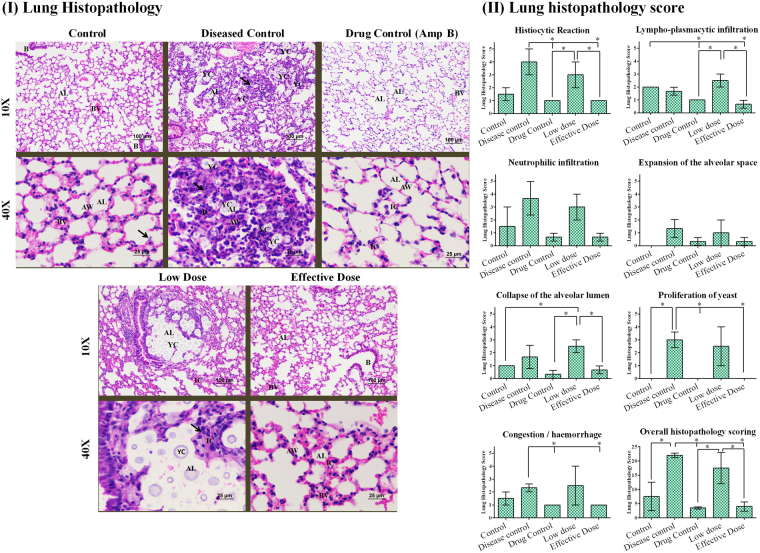
Figure 4.
(I) Lung Histopathology: Lungs section of control group mice with normal alveolar wall (AW) and its capillaries. The pneumocytes, alveolar lumina (AL) and blood vessels (BV) were normal. Few alveolar macrophages (arrow), normally present in alveolar wall were observed. Bronchial (B) walls and their epithelial cells were normal. Disease control group mice with collapsed alveolar lumina (arrow); accumulation of numerous inflammatory cells (IC) in and around, alveolar lumina (AL) and alveolar wall (AW). Abundance of yeast cells (YC) in alveolar lumina (AL). Drug control group mice with normal alveolar walls; Inflamatory cells (IC) were normally present in alveolar wall (AW). Pulmonary blood vessel (BV) normally present. Absence of yeast cells in alveolar lumina (AL). Low dose group mice group with expansion of Alveolar lumina (AL); accumulation of inflamatory cells (IC) in and around, alveolar lumina and alveolar wall. Abundance of yeast cells (YC) in Alveolar lumina (AL). Effective dose group mice with minimal alveolar expansion and normal alveolar walls (AW); Inflamatory cells (IC) were normally present in alveolar wall (AW). Pulmonary blood vessel (BV) normally present. Absence of yeast cells in alveolar lumina (AL). Bronchial (B) walls and their epithelial cells were normal (H&E). (II) Lung histopathology score for BALB/c mice treated with compound-6. The histopathological parameters such as histiocytic reaction, lympho-plasmacytic infiltration, neutrophilic infiltration, expansion of the alveolar space, collapse of the alveolar lumen, proliferation of yeast and congestion/haemorrhage was observed for all the groups. Based on overall histopathology scoring, the disease control was marked with high score followed by low dose, control, drug control and effective dose. Bar represents mean and SD for duplicates. *Represents p ≤ 0.05; comparison by two-way ANOVA followed by Tukey’s multiple comparisons test (Supplementary Table S6) and graphs were obtained using GraphPad Prism software.

