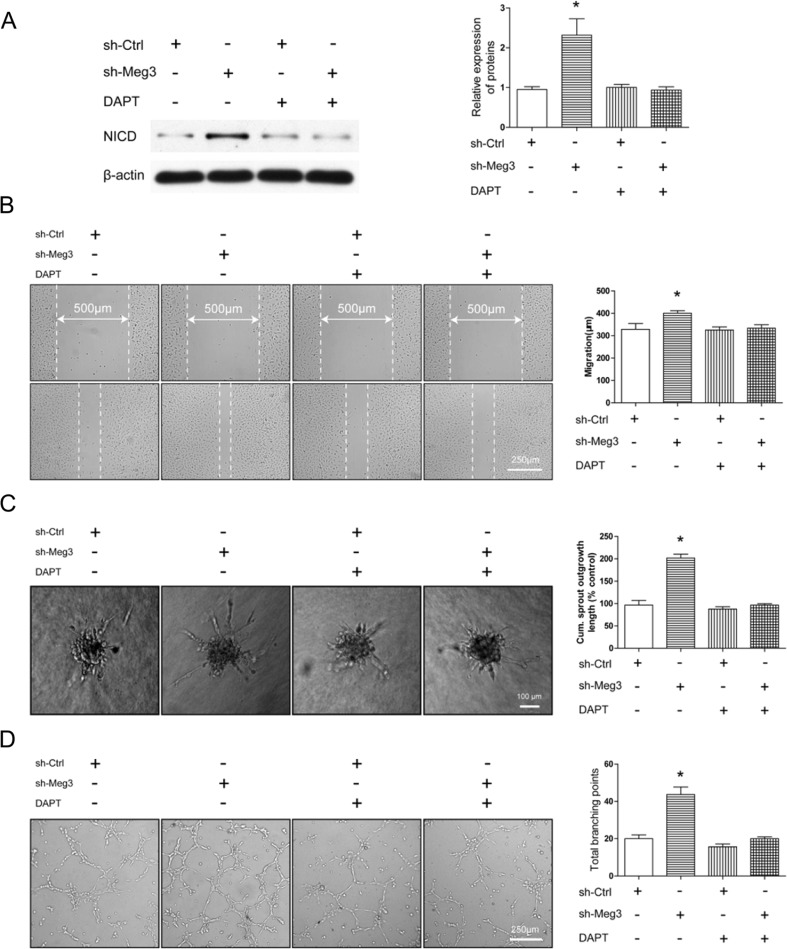
Fig. 7.
Notch inhibition impairs Meg3-induced angiogenic migration and sprouting. a sh-Ctrl and sh-Meg3 HMEC-1 were treated with or without DAPT, and NICD was quantified by Western blotting after 24 h. b Representative images of sh-Ctrl and sh-Meg3 HMEC-1 migration. Bar graph shows quantification of the migration distance of cells treated with or without DAPT. c Representative images of sh-Ctrl and sh-Meg3 HMEC-1 spheroid sprouts. Bar graph shows quantification of the cumulative sprout length per spheroid with or without DAPT treatment. d Representative images of sh-Ctrl and sh-Meg3 HMEC-1 tube formation. Bar graph shows the total loops of tube formation treated with or without DAPT. *P < 0.05 versus sh-Ctrl

