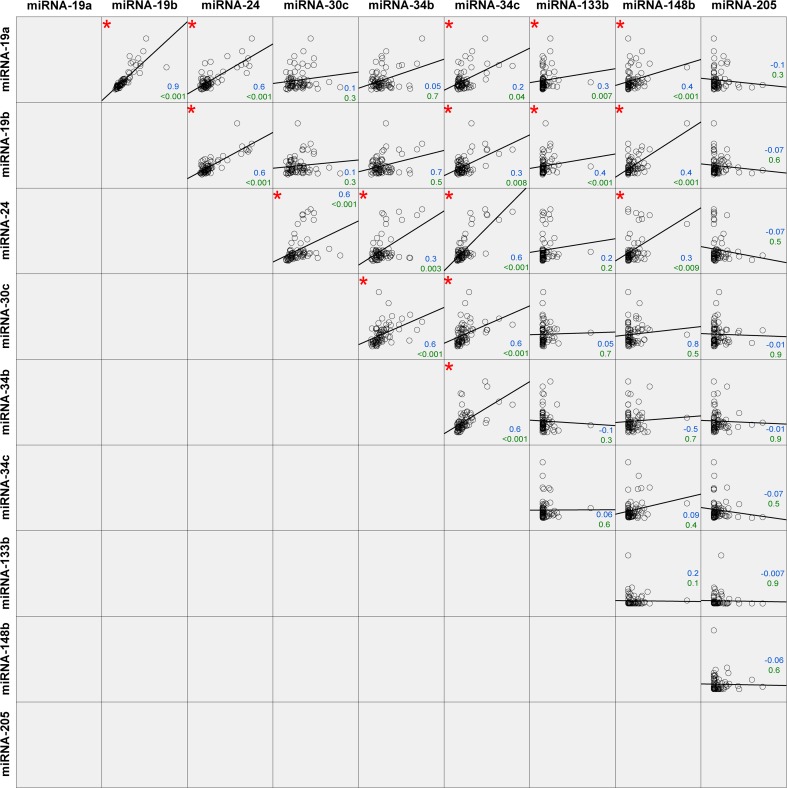
Fig. 3.
Correlation analysis of all miRNAs among the three disease groups. In total, 16 statistically significant correlations (p value below 0.05) were found, indicated with a red asterisk. Spearman’s rho coefficient value (upper value (in blue)) and p value (lower value (in green)) are indicated in the graphs

