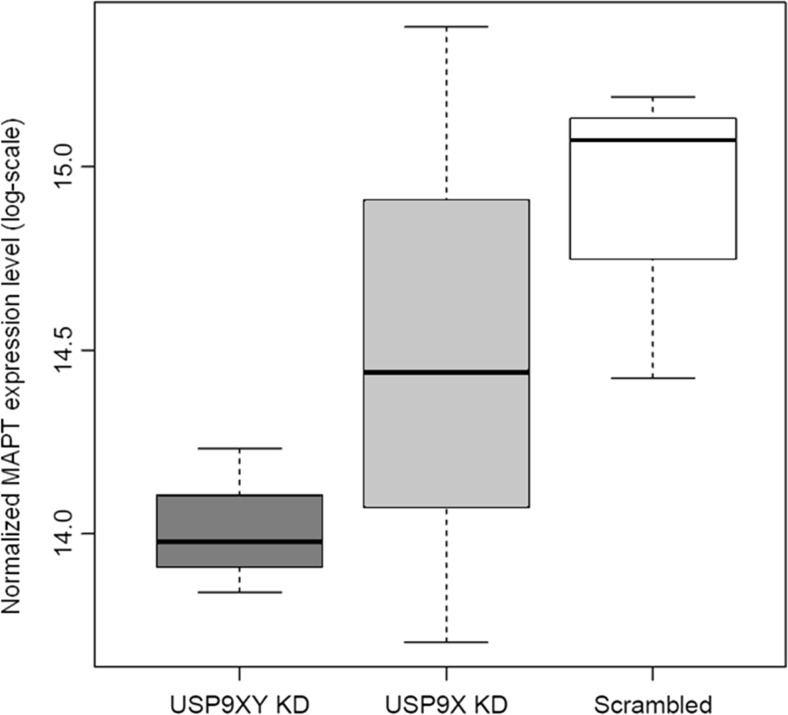
Fig. 5.
Normalized MAPT expression levels on log-scale in the USP9XY and USP9X knockdowns (KD) and the scrambled control (scrambled) for the MAPT genetic probe with the highest average expression in the DU145 microarray dataset. Decreased median MAPT expression levels are observed for both knockdowns (p = 0.017 for the USP9XY knockdown and p = 0.44 for the USP9X knockdown)

