
Fig. 4.
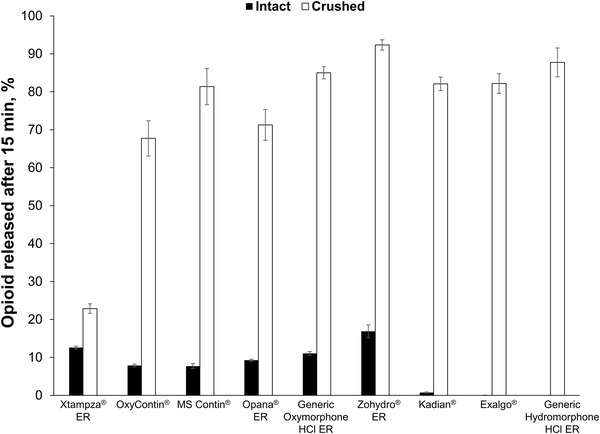
Dissolution profiles of intact versus crushed extended release (ER) opioid products. The mean (± standard deviation) percent of the total amount of opioid release over 15 min is shown
Official websites use .gov
A
.gov website belongs to an official
government organization in the United States.
Secure .gov websites use HTTPS
A lock (
) or https:// means you've safely
connected to the .gov website. Share sensitive
information only on official, secure websites.
Dissolution profiles of intact versus crushed extended release (ER) opioid products. The mean (± standard deviation) percent of the total amount of opioid release over 15 min is shown