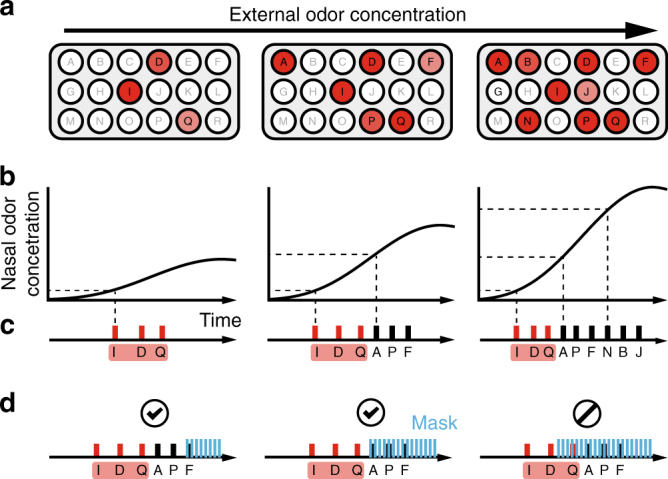
Fig. 1.

Primacy coding of odor identity. a Schematic presentation of the patterns of glomerulus (OSN) activation for three concentrations of the same odor. The total number of active glomeruli increases with an increase of odor concentration. b The temporal profiles of the odor concentration in the nose during inhalation for three concentrations of the presented stimuli. Dashed lines represent concentration thresholds for representative glomeruli (horizontal) and corresponding response latencies (vertical). c Temporal sequence of glomeruli activation for three different odor concentrations. d Optogenetic mask schematic demonstrating the effect of the optogenetic mask on temporal sequences when presented late and early relative to odor-evoked temporal pattern
