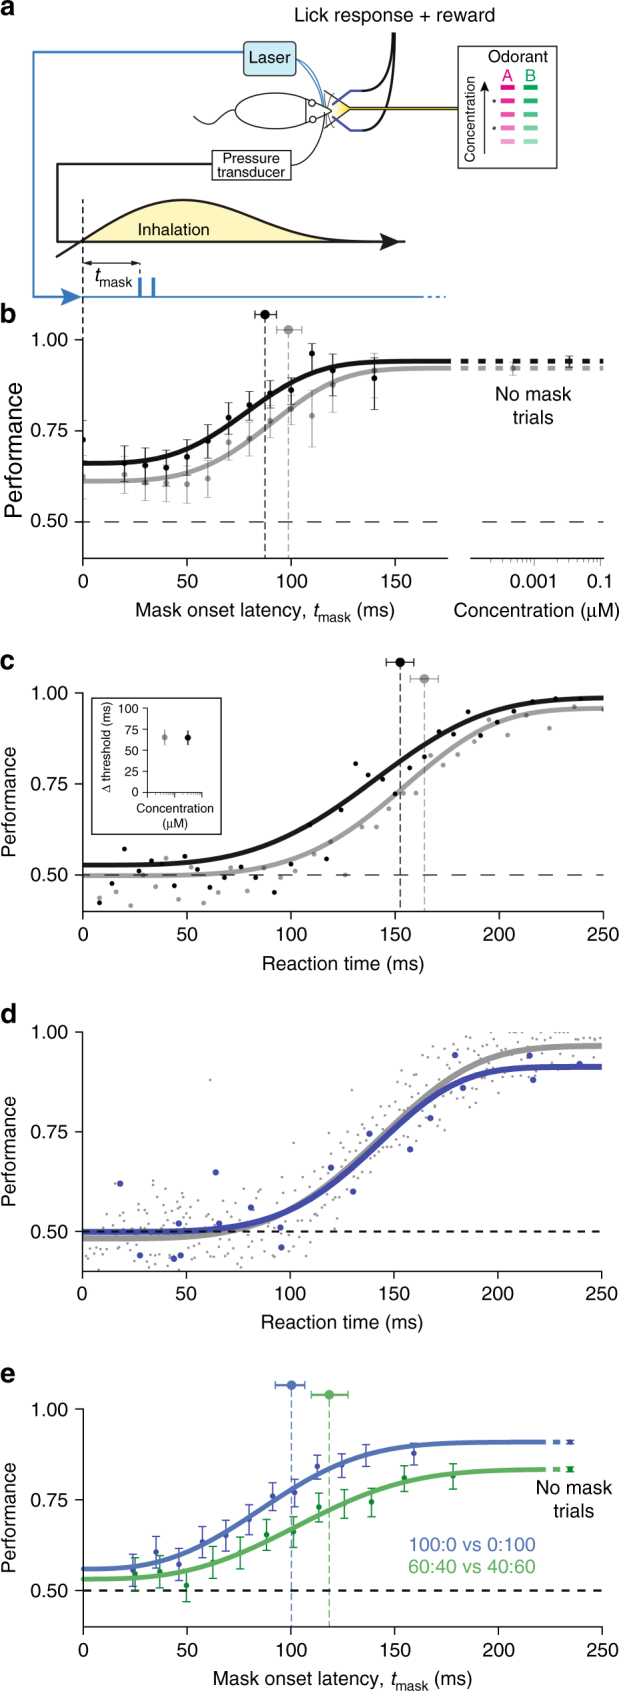
Fig. 3.

Optogenetic masking behavioral paradigm. a Behavioral task schematic: Mice were trained to respond to 2 odors "A" and "B" at 5 different concentrations to lick left or right water spout. Mask timed to the onset of the first inhalation after odor delivery was presented during subset of trials for two concentrations (asterisks). b Discrimination performance vs. mask latency for odors (2-hydroxyacetophenone and eugenol) at two concentrations. Mask stimulus presentation was initiated on the first inhalation of odorant and after the mask onset latency, t mask, had elapsed. High concentration annotated in black markers, low concentration in grey. Error bars indicate 95% confidence interval estimates. Weibull fit to the data indicated with thick lines. Markers above performance curves indicate Weibull threshold latency values for each fit with 95% confidence interval estimates. c Mouse reaction time vs. performance in unmasked stimuli of two concentrations (as above). Dots indicate the data binned into bins of 125 trials. Lines indicate Weibull fit. Inset: difference between mask and reaction time threshold latencies. d Mouse reaction time vs. performance for unmasked trials (gray) compared with late masked trials with t mask > = 100 ms (blue) for the same data set. Points represent bins of 50 trials each. e Performance vs. mask latency for discrimination of pure (blue) carvone enantiomers vs. mixtures made with those odorants (green)
