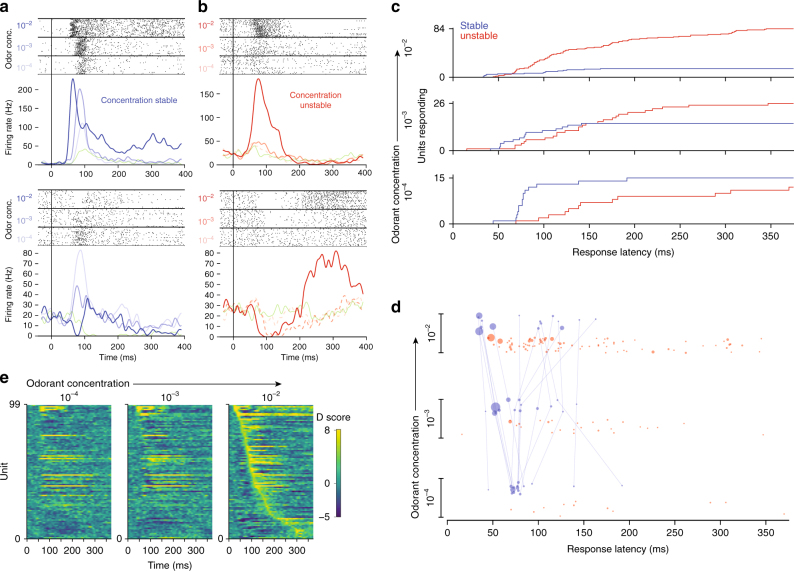
Fig. 4.
Concentration invariant MT cell response latencies correspond with behavior. a Example raster and PSTH of two MT cells, which were responsive to odorant across 3 orders of magnitude concentration. t = 0 corresponds to inhalation onset. b Same plots for MT cells which respond to only a subset of concentrations. Dashed PSTH lines represent responses that did not cross the threshold for significance (see methods). c Cumulative distributions of MT cell response latencies. d Response latencies of MT cell-odor pairs across concentrations for concentration-stable and unstable units. Units’ responses across concentrations are connected. Area of each point in the plot is proportional to the Cohen’s D-score of the response over non-odor response (see “methods” section). Point positions are randomly jittered on the concentration axis for visibility. e Odor responses sorted by units’ response latencies at the highest concentration of odorant. Responses are represented as D-scores, where positive and negative scores are excitation and inhibition relative to blank inhalation responses

