Fig. 5.

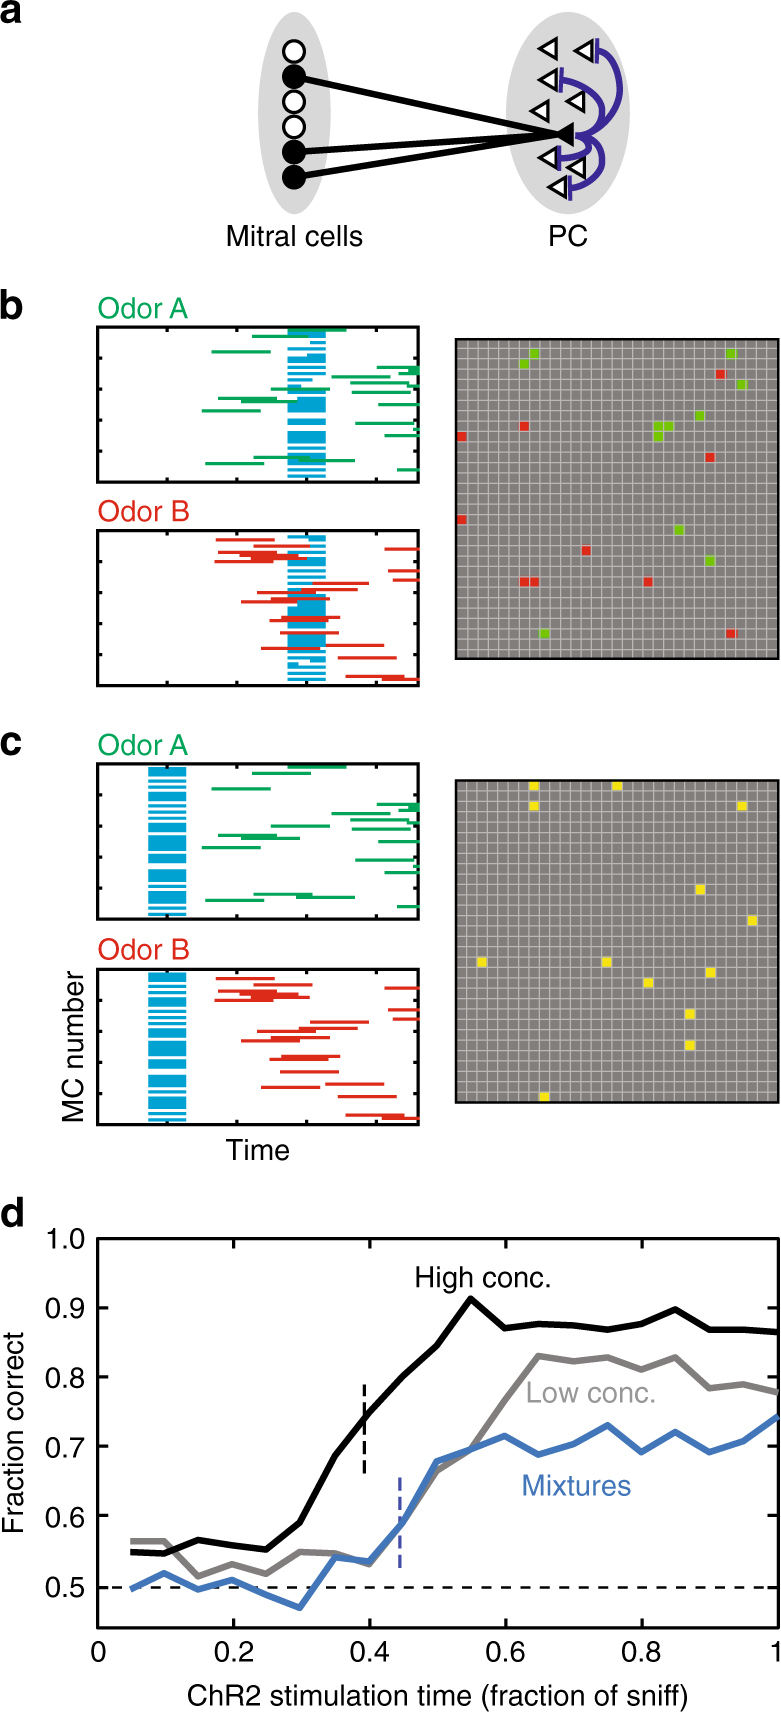
Computational model of primacy decoder can explain behavioral effects of mask. a The schematic of the network included in the computational model. Pyramidal neurons in PC receive random excitatory connections from MT cells (black lines) and connected to a random subset of other pyramidal neurons via inhibitory connections (blue lines). The inhibitory connections are responsible for blocking of the inputs to PC after the initial (primary) representation is formed. b, c Responses of MCs (100 out of 300) and PC cells for late (b) and early (c) masks. MCs respond to Odor A, Odor B, and ChR2 (green, red, cyan). PC responses at the end of sniff cycle (gray squares) are shown for two odors in the same panel. For the early mask (c), PC responses are indistinguishable for two smells (yellow). d Discrimination success rate as a function of mask latency for three conditions: odors A vs. B—high concentrations (black line), odors A vs. B–low concentrations (gray line), odor mixtures 60% A + 40% B vs. 40% A + 60% B (blue line). Low/high concentration conditions were introduced by expanding/compressing the timing of MC odorant-related inputs within the sniff cycle. Mixtures were introduced by combining together high conc. sequences of inputs corresponding to odors A and B. The temporal dependencies reproduce the basic qualitative features of data (Fig. 2b, e), including concentration-dependence of the error rate at different ChR2 timings
