
Fig. 10.
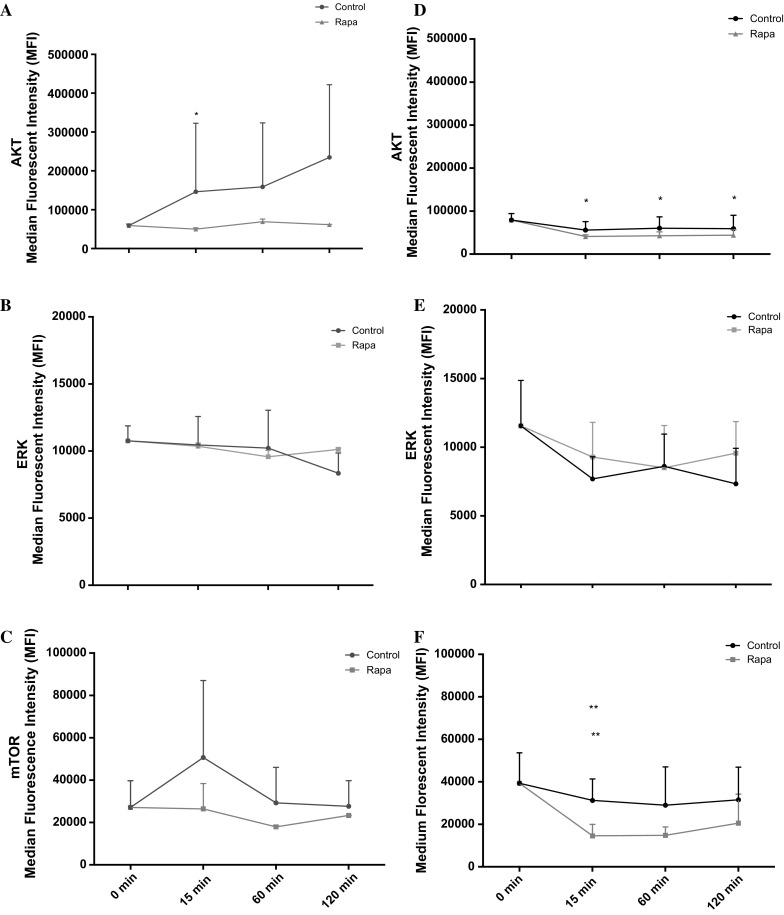
Line charts illustrating the differences in the phosphorylation of aged Akt (a), ERK (b) and mTOR (c) and control Akt (d), ERK (e) and mTOR (f) molecules, with cells treated with rapamycin over 120 min. The data is shown as mean with SD. Significance was indicted versus 0 min (*) and versus corresponding time-point (**). The experiment consisted of 3 repeats all in duplicate