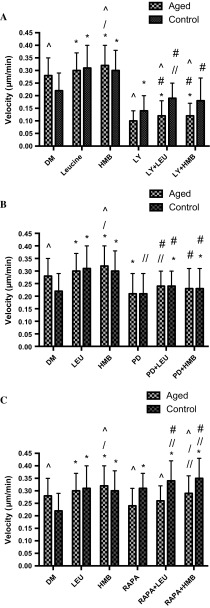
Fig. 7.
Bar charts illustrating the differences in cell velocity with the inhibition of LY294002 (a), PD98059 (b), and rapamycin (c) in the presence or absence of leucine and HMB over 48 h. The data is shown as mean with SD. Significance is set at P < 0.05. Significance was shown as: aged versus control (^), versus control (*), versus inhibitor (//), leucine versus HMB (/) and inhibitor with supplement versus supplement alone (#). The experiment consisted of 3 repeats all in duplicate

