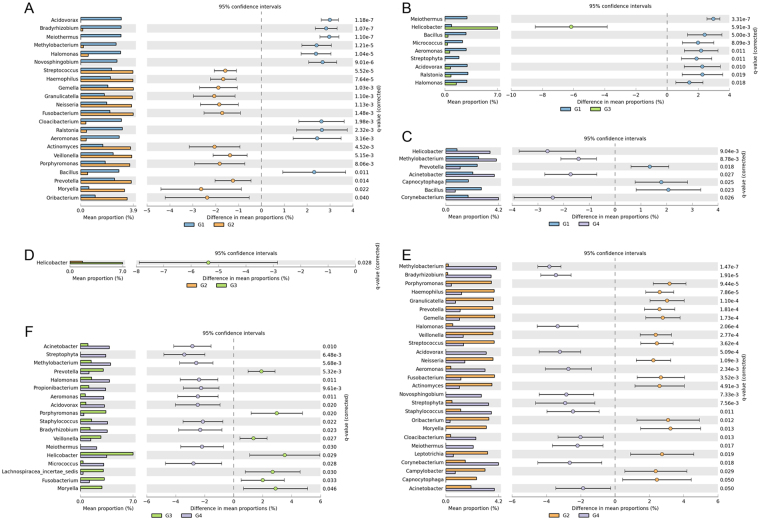
Figure 2.
Pair-wise comparisons of microbial population of sample groups. (A) Comparison of microbial abundances between sample groups G1 and G2. (B) Comparison of microbial abundances between sample groups G1 and G3. (C) Comparison of microbial abundances between sample groups G1 and G4. (D) Comparison of microbial abundances between sample groups G2 and G3. (E) Comparison of microbial abundances between sample groups G2 and G4. (F) Comparison of microbial abundances between sample groups G3 and G4.

