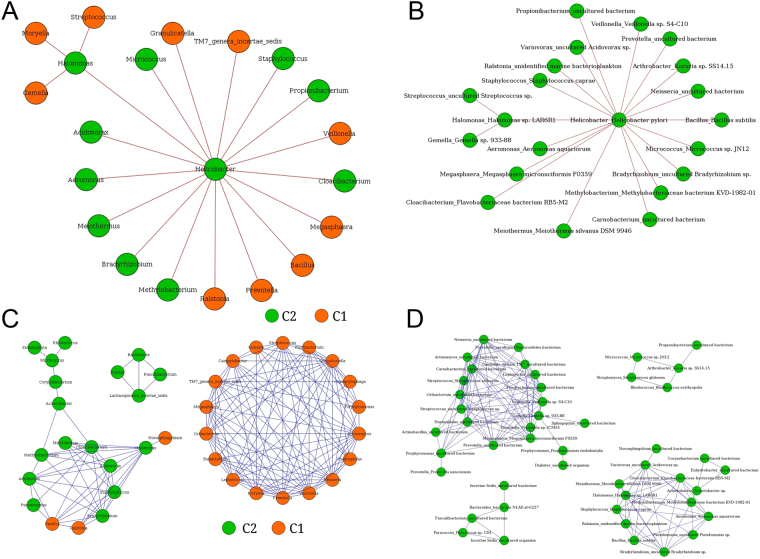
Figure 4.
Interaction networks of microbes in the Indian samples. (A) Negative interaction network of microbial genera showing Helicobacter as lone hub. (B) Negative interaction network at OTU level showing similar trends and H. pylori acting as hub node. (C) Co-occurrence network showing interaction specificity of bacterial genera. Orange nodes correspond to microbes belonging to clade C1 and green nodes correspond to members of cluster C2. (D) Co-occurrence network of OTUs, showing similar associations.

