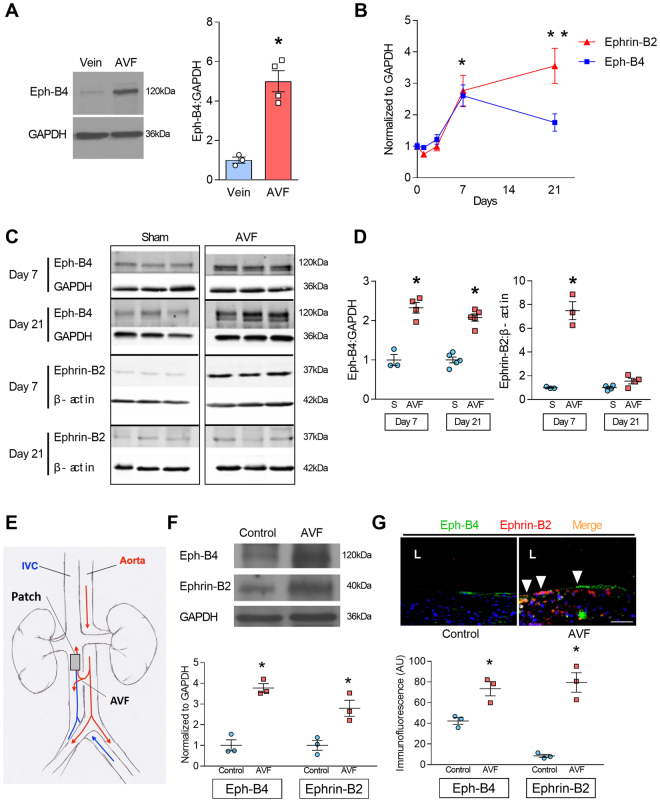
Figure 1.
Increased Eph-B4 and Ephrin-B2 expression during adaptive venous remodeling. (A) Western blot and adjacent bar graph of densitometry showing human Eph-B4 expression in AVF venous limb compared to normal vein. *P = 0.0016; t-test. n = 3–4. (B) Line graphs show expression of Eph-B4 (blue) and Ephrin-B2 (red) in the AVF venous limb compared to sham IVC; P < 0.0001 (ANOVA). *P < 0.05 (P = 0.0123, Eph-B4; P = 0.0041, Ephrin-B2; post hoc); **P < 0.05 (P < 0.0001, Ephrin-B2; post hoc). n = 5–8. (C) Western blots showing Eph-B4 and Ephrin-B2 protein expression in AVF venous limb compared to sham IVC. n = 3–5. (D) Graphs showing densitometry of Eph-B4 (left panel) and Ephrin-B2 (right panel) expression in the AVF venous limb compared to sham IVC; *P < 0.05 (P < 0.0001, Eph-B4 day 7, AVF vs sham; P < 0.0001, Eph-B4 day 21, AVF vs sham; P < 0.0001, Ephrin-B2 day 7, AVF vs sham; post hoc). n = 3–5. (E) Diagram of rat model showing location of infrarenal IVC pericardial patch exposed to an aortocaval AVF (n = 6 per group). (F) Representative Western blot (upper panel) showing Eph-B4 and Ephrin-B2 expression in patch neointima (day 14) of control vein compared to patch neointima of AVF vein. Graphs (lower panel) show quantification of western blot bands; P < 0.0001 (ANOVA). *P < 0.05 (P = 0.0003, Eph-B4; P = 0.0043, Ephrin-B2; post hoc). n = 3. (G) Representative photomicrographs (upper panel) showing Eph-B4 (green) and Ephrin-B2 (red) immunoreactive signal (day 14). White arrowheads indicate colocalization of Eph-B4 and Ephrin-B2. L, vessel lumen. Graph (lower panel) shows quantification of immunoreactive signal; P < 0.0001 (ANOVA). *P < 0.05 (P = 0.0136 Eph-B4; P < 0.0001 Ephrin-B2; post hoc). n = 3. Scale bar 100 µm. Data represent mean ± SEM.

