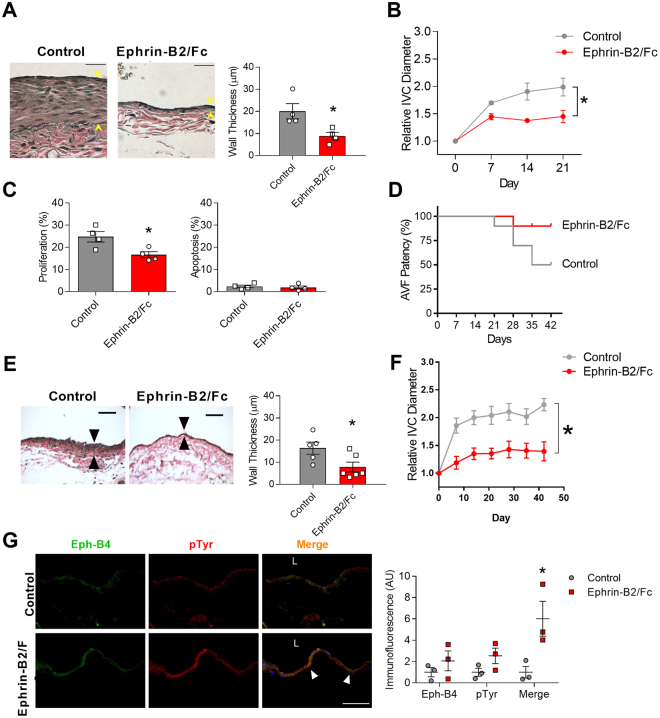
Figure 2.
Activation of Eph-B4 regulates venous remodeling. (A) Representative photomicrographs (left panel) and bar graph (right panel) showing AVF venous wall thickness in AVF treated with control or Ephrin-B2/Fc (day 21); *P = 0.03 (t-test). n = 4. Scale bar, 25 µm. (B) Line graph showing IVC diameter in mice treated with control or Ephrin-B2/Fc; *P < 0.0001 (ANOVA). n = 4–5. (C) Bar graphs showing percentage of cells in the AVF positive for proliferation (Ki67) or apoptosis (cleaved caspase-3) (day 21); *P = 0.02 (t-test). n = 4. (D) Line graph showing AVF patency in mice treated with control or Ephrin-B2/Fc injections. P = 0.05 (Chi-square); P = 0.06 (Log-rank), n = 10. (E) Representative photomicrographs (left panel) and bar graph (right panel) showing AVF venous wall thickness in AVF treated with control or Ephrin-B2/Fc (day 42); *P = 0.04 (t-test). n = 5–6. Scale bar, 50 µm. (F) Line graph showing IVC diameter in mice treated with control or Ephrin-B2/Fc; *P < 0.0001 (ANOVA). n = 13–14. (G) Representative photomicrographs (left panel) and graph (right panel) showing Eph-B4 (green), phosphotyrosine (pTyr; red), and merged (yellow) immunoreactive signal with control (top row) or Ephrin-B2/Fc (bottom row) (day 21). Yellow arrowheads indicate merged signal. P = 0.0042 (ANOVA). *P = 0.0052 (post hoc). n = 3. Scale bar, 100 µm. Data represent mean ± SEM.

