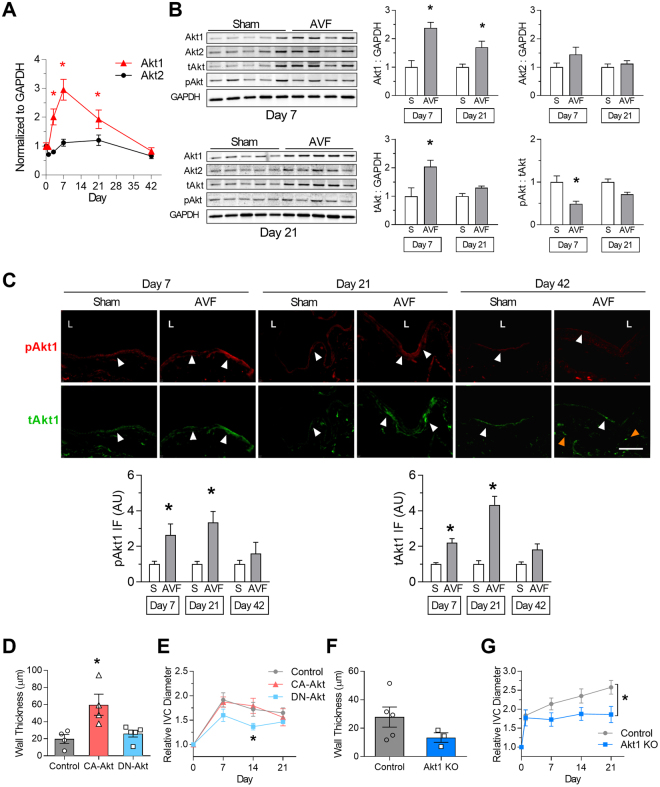
Figure 5.
Akt1 mediates venous remodeling in vivo. (A) Line graph showing Akt1 and Akt2 mRNA expression in venous limb of AVF; P < 0.0001 (ANOVA). *P < 0.05 (P = 0.0127 at day 3; P < 0.0001 at day 7; P = 0.0289 at day 21; post hoc). n = 7–8. (B) Representative Western blots (left hand panels) showing Akt1, Akt2, tAkt, and pAkt expression in sham veins and venous limb of AVF. Bar graphs (right hand panels) show quantification. Akt1: P < 0.0001 (ANOVA). *P < 0.05 (P = 0.0005 at day 7; P = 0.0415 at day 21; post hoc). Akt2: P = 0.08 (ANOVA). tAkt: P = 0.0032 (ANOVA). *P < 0.05 (P = 0.0039 at day 7; post hoc). pAkt:tAkt ratio: P = 0.0007 (ANOVA). *P < 0.05 (P = 0.0041 at day 7; post hoc). n = 4–5. (C) Representative immunofluorescence (upper panels) showing pAkt1 (red) and tAkt1 (green) signal in sham veins or AVF, day 7 (left columns), day 21 (middle columns), or day 42 (right columns). White arrowheads denote positive signals in endothelium; orange arrowheads denote positive signals in subintima. L = vessel lumen. Bar graphs (lower panel) show quantification of immunoreactive signal. pAkt1; P = 0.0030 (ANOVA). *P < 0.05 (P = 0.0422 at day 7; P = 0.0339 at day 21; post hoc). tAkt1; P < 0.0001 (ANOVA). *P < 0.05 (P = 0.0214 at day 7; P = 0.0002 at day 21; post hoc). n = 3–4. Scale bar, 100 µm. (D) Bar graph showing AVF venous limb wall thickness in WT mice treated with control adenovirus (gray bar), CA-Akt adenovirus (red bar), or DN-Akt adenovirus (blue bar) (day 21); P = 0.0095 (ANOVA). *P < 0.05 (P = 0.0121 CA-Akt vs control; P = 0.0232 CA-Akt vs DN-Akt; post hoc). n = 4–5. (E) Line graph showing infrarenal IVC diameter in WT mice treated with control adenovirus (gray line), CA-Akt adenovirus (red line), or DN-Akt adenovirus (blue line); P = 0.0068 (ANOVA). *P < 0.05 (P = 0.0458 at day 14, DN-Akt vs control; P = 0.0138 at day 14, DN-Akt vs CA-Akt; post hoc). n = 4–5. (F) Bar graph showing AVF wall thickness in WT and Akt1 KO mice (day 21); P = 0.19 (t test). n = 3–5. (G) Line graph showing infrarenal IVC diameter in WT (gray) and Akt1 KO mice (blue); *P = 0.0012 (ANOVA). n = 8–14. Data represent mean ± SEM.

