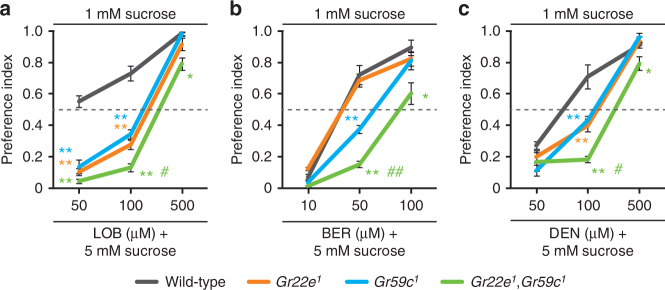
Fig. 6.
The contribution of Gr22e and Gr59c to bitter food aversion. Two-way choice assays using the indicated concentrations of a LOB, b BER, and c DEN. n = 4–12. ANOVAs followed by Tukey post hoc tests or Kruskal−Wallis tests followed by Mann−Whitney U post hoc tests as appropriate. All data are presented as means ± S.E.M. The asterisks and sharps indicate statistically significant differences from wild-type flies (*p < 0.05, **p < 0.01) and from both Gr22e 1 and Gr59c 1 (# p < 0.05, ## p < 0.01), respectively

