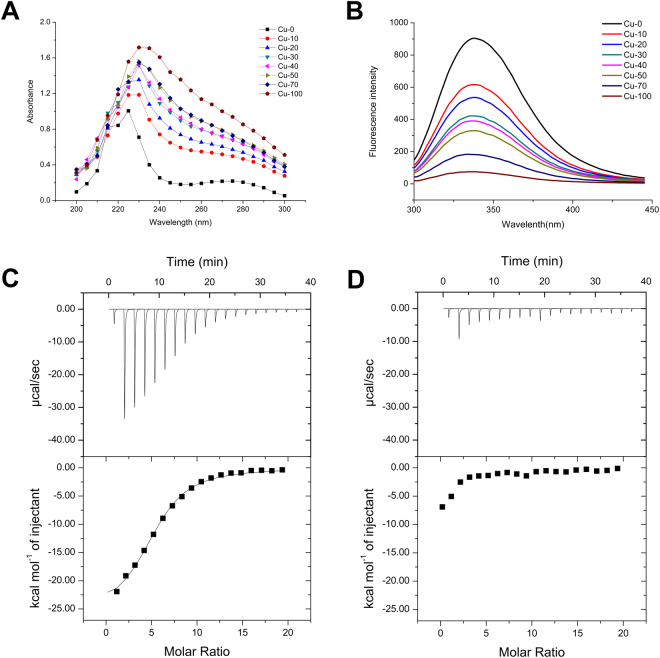
Figure 6.
(A) UV-Vis absorbance spectra of NfoR in the presence of Cu (II). Reaction mixtures (1 mL), containing 20 mM Tris-HCl buffer (pH 7.0), 5 μM NfoR, and different concentrations of Cu (II), were incubated for 30 min at 37 °C. (B) Fluorescence emission spectra of NfoR, excited at 280 nm in the presence of Cu (II), NfoR concentration (5 × 10⁻⁶ mol L−1), Cu (II) concentration (0, 10, 20, 30, 40, 50, 70, or 100 × 10−6 mol L–1). (C,D) Isothermal calorimetry (ITC) analyses of NfoR. Approximately 10 mM Cu (II) (C) and Ni (II) (D) were injected into 0.1 mM NfoR, respectively.

