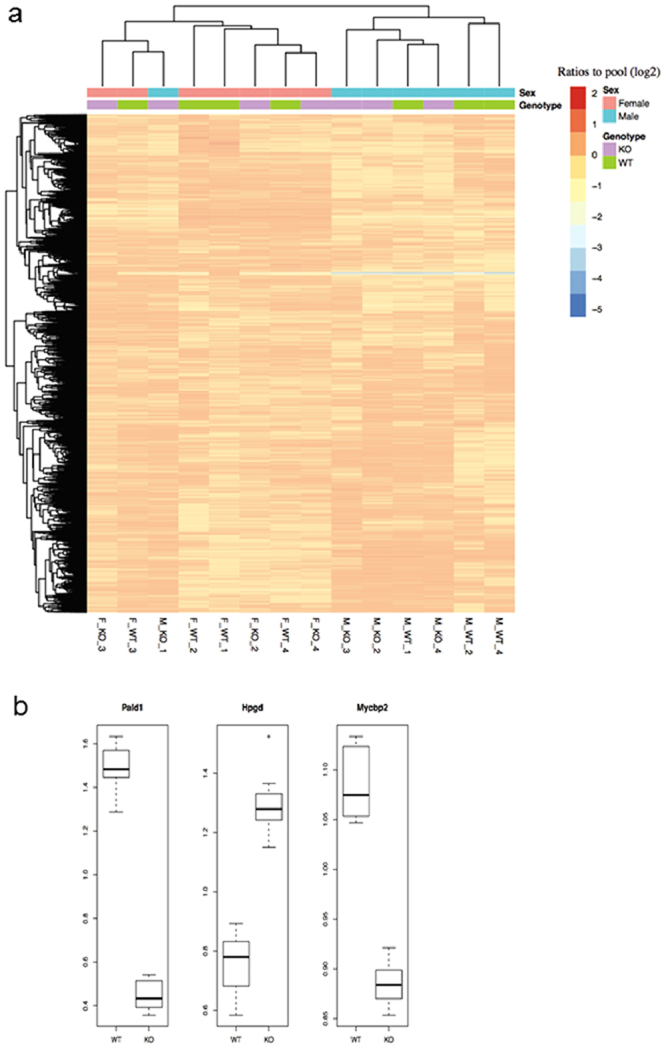
Figure 6.

Proteomics data overview and significantly differentially expressed proteins. (a) Proteomics reveals sex-dependent protein expression differences in lung tissue. The heatmap shows proteome data overview of 8635 proteins with overlapping quantification in all 4 weeks of age lung samples using hierarchical clustering. Columns and rows represent lung samples and proteins, respectively. The samples are labels as sex_genotype_ID. The major factor for clustering is sex, and not genotype. (b) Boxplot of the three significantly differentially expressed proteins. The y-axis shows the ratios to the pool. For each gene, the ratios to the pool in the wild type group (WT) and knock-out group (KO) are plotted in the boxplot, respectively.
