Fig. 6.
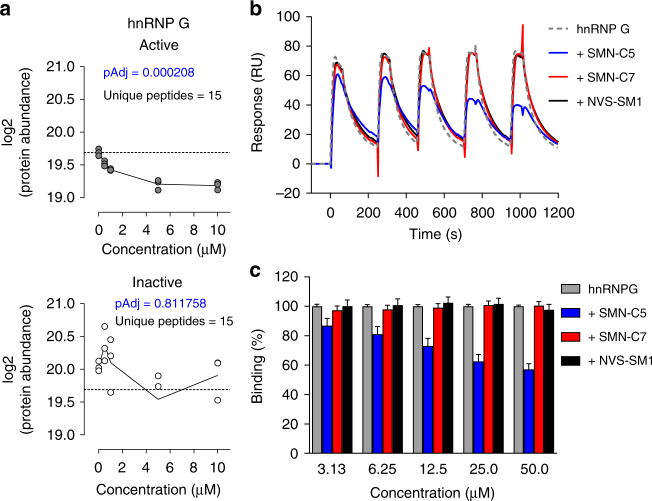
Displacement of hnRNP G from SMN2 exon 7 ESE2 by small molecule splicing modifiers. a Protein abundance (log2) of hnRNP G after affinity enrichment with the SMN2 ESE2 RNA sequence as bait, in the presence of increasing concentrations of Active (SMN-C6) or Inactive (SMN-C7) ligand. b SPR-binding curves monitored for hnRNP G RRM over ESE2 surface at a single hnRNP G concentration of 1.5 µM (green) and competition of hnRNP G-ESE 2 interaction by SMN-C5 (blue), SMN-C7 (red), or NVS-SM1 (black). ESE2 was immobilized on a streptavidin surface (CAP sensor) to a density of ~25 RU. Small molecules were titrated from 3.13 to 50 µM at constant hnRNP G concentration (1.5 µM). c Quantitative assessment of normalized SPR signals of competition experiments in b. SPR signals were measured in the middle of the association phase and normalized according to immobilized levels of ESE2. 100% binding corresponds to the binding of hnRNP G to ESE2 at 1.5 μM. Data in c represent means ± SEM of five independent experiments illustrated in b

