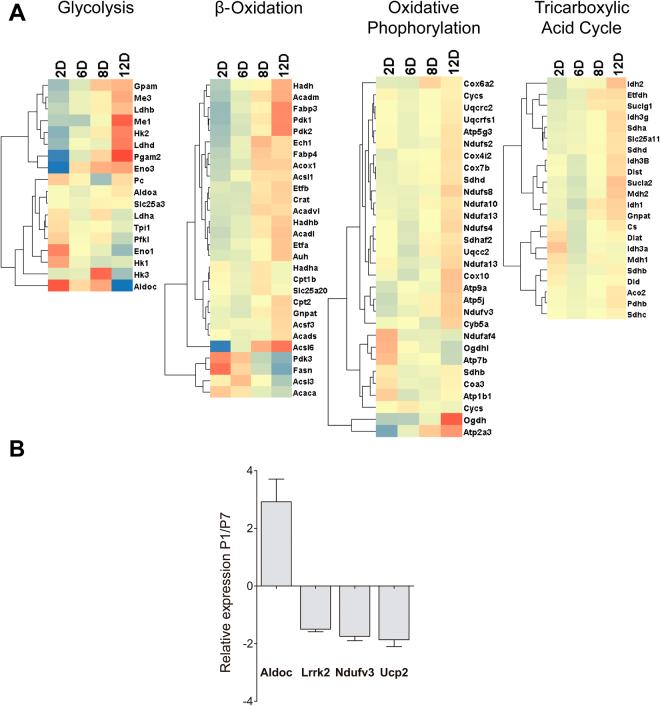
Figure 1.
Gene expression analysis. (A) Heat map showing gene expression assayed by RNASeq. The heat maps show gene clusters involved in glycolysis, β-oxidation, oxidative phosphorylation and the tricarboxylic acid cycle in rat hearts from 2, 6, 8, and 12 days after birth (n = 6 for both). (B) Quantitative RT-PCR analysis of genes involved in cell metabolism. Bars indicate the relative expression (2−ΔΔct) for P1 versus P7 hearts (n = 6 for both) of Aldolase c (a glycolysis enzyme) and mitochondrial Lrrk2, Ndufv3, and Ucp2; t-test, p < 0.05.

