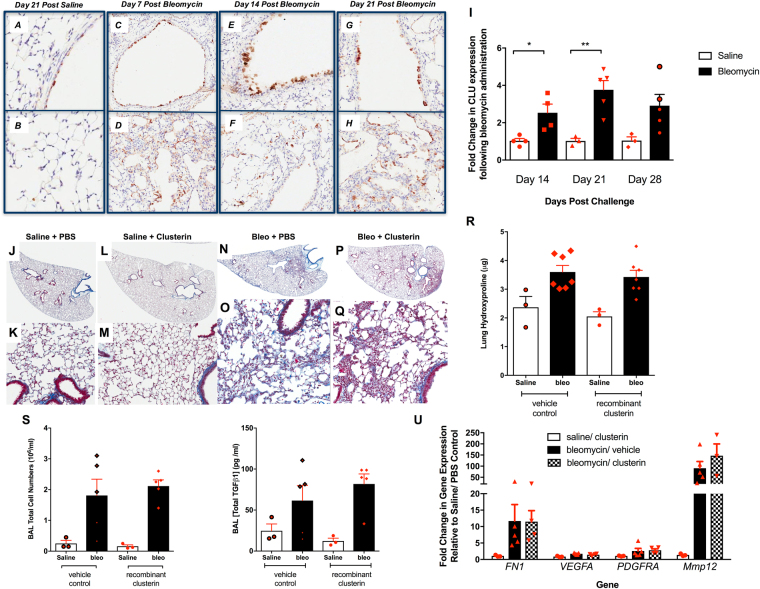
Figure 2.
Induction of Clusterin in response to bleomycin-induced lung injury. (A–H) C57Bl/6 mice were given bleomycin intratracheally and CLU expression was visualized by IHC after 7 (C,D), 14 (E,F) and 21 (G,H) days of bleomycin instillation and compared to staining in the lungs of Day 21 saline treated mice (A,B). (I) Clusterin transcript expression was quantitated after 14, 21 and 28 days of bleomycin instillation by RT-PCR in whole lung samples. Data are expressed as Mean ± SEM*P ≤ 0.05, **P ≤ 0.01 significance to relevant control levels. (J–Q) Saline or bleomycin challenged C57Bl/6 mice were treated with 20 µg of recombinant Clusterin every three days starting at Day 2. Shown are representative histological images of the lungs stained with Masson’s trichrome from saline + PBS vehicle (J,K), saline + Clusterin (L,M), bleomycin + PBS (N,O) and bleomycin + Clusterin (P,Q) treated mice. The top images are of whole scans of the lungs and the bottom images are taken at 200x magnification. (R) Collagen content in the lungs of the recombinant Clusterin and vehicle treated mice was biochemically quantified using a hydroxyproline assay. Shown is the average hydroxyproline (µg) from right lung lobes. (S,T) Shown is the average total BAL cell number (S) and the total TGFß levels (T) in the lungs of vehicle or Clusterin treated mice 15 days after bleomycin challenge. (U) FN1, VEGFA, PDGFRA and MMP12 transcript expression was quantified in whole lung samples 15 days after bleomycin, vehicle and/or Clusterin treatment. Shown is the average expression from 3 Saline/PBS, 3 Saline/rClusterin, 7 Bleo/PBS and 7 Bleo/rClusterin treated mice.

