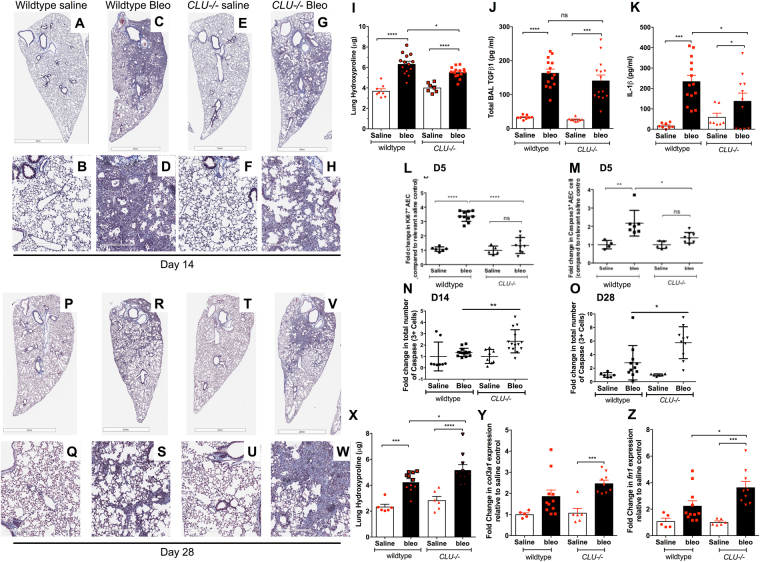
Figure 3.
Clusterin deficient mice show persistent fibrosis in response to bleomycin. WT or CLU −/− received bleomycin intratracheally on Day 0. (A–H) Depicted is Masson’s Trichrome histological staining of WT saline (A,B), WT bleomycin (C,D), CLU−/− saline (E,F) and CLU−/− bleomycin (G,H) treated lungs fourteen days after instillation. Shown are whole lung images (top) and magnified images (bottom). (I) Collagen content in the lungs of the of bleomycin treated wildtype and CLU−/− mice was biochemically quantified using a hydroxyproline assay, 14 days after bleomycin instillation. Shown is the average hydroxyproline (µg) from right lung lobes. (J) Shown is the average total TGFβ levels in the BAL from wildtype and CLU−/− mice, 14 days after bleomycin challenge. (K) Shown is the average IL-1β levels in whole lung lysates from wildtype and CLU−/− mice, 14 days after bleomycin challenge. (L,M) The proliferative status (L) and Caspase3 expression (M) in live CD45− EpCAM+ epithelial cells was assessed via Ki67 and activated Caspase-3 staining, respectively, 5 days after bleomycin challenge. Depicted is the fold change in cell number in response to bleomycin, relative to its relevant saline control. (N,O) IHC analysis for cleaved Caspase3 was performed on fibrotic murine lungs and quantified using Aperio Scanscope software. Depicted is the fold change in clusters, as defined by three or more adjacent positive cells, staining for cleaved Caspase3, 14 (N) and 28 (O) days after bleomycin challenge, compared to relevant saline control. (P–W) Depicted is Masson’s Trichrome histological staining of WT saline (P,Q), WT bleomycin (R,S), CLU−/− saline (T,U) and CLU−/− bleomycin (V,W) treated lungs 28 days after instillation. Shown are whole lung images (top) and magnified images (bottom). (X) Collagen content in the lungs of the of wildtype and CLU−/− treated mice was biochemically quantified using a hydroxyproline assay 28 days after bleomycin instillation. Shown is the average hydroxyproline (µg) from right lung lobes. (Y,Z) Quantitative PCR analysis was performed on RNA purified from lungs of 28-day saline and bleomycin treated murine lungs. Shown is the average col3a1 (Y) and fn1 (Z) transcript expression. Data are Mean ± SEM., n = 8–13 mice/ group. *P ≤ 0.05, **P ≤ 0.01, ***P ≤ 0.005, ****P ≤ 0.001 significance, or as stated. ns = not significant.

