Figure 4.
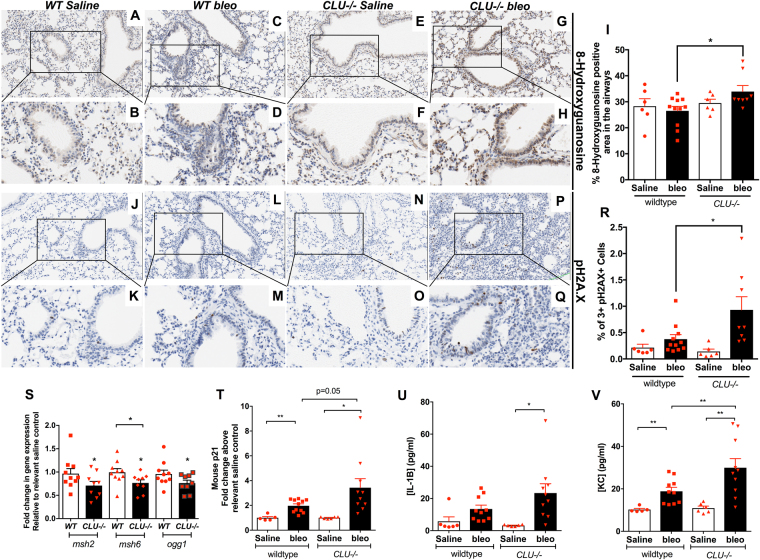
CLU−/− show increased oxidative DNA damage, decreased MSH2, MSH6 and OGG1 transcript expression and increased expression of senescence markers. Twenty-eight days after bleomycin instillation in wildtype and CLU−/− mice, lungs were histologically stained for various markers for DNA damage. (A–H) Depicted are representative images for wildtype saline (A,B), wildtype bleomycin (C,D), CLU−/− saline (E,F) and CLU−/− bleomycin (G,H) treated lungs stained for the oxidative DNA adduct, 8-Oxo-2′-deoxyguanosine (8-Oxo-dG). (I) Depicted is 8-Oxo-dG staining intensity in airway epithelial cells as determined using Aperio Scanscope software in saline and bleomycin treated wildtype and CLU−/− mice. (J–Q) Depicted are representative images for wildtype saline (J,K), wildtype bleomycin (L,M), CLU−/− saline (N,O) and CLU−/− bleomycin (P,Q) treated lungs stained for DNA double-strand break associated histone, phospho-H2A.X. (R) Depicted is the percent of cell clusters, as defined by three or more adjacent positive cells, staining for p-H2A.X, as determined using Aperio Scanscope software in saline and bleomycin-challenged wildtype and CLU−/− mice. (S) Depicted is the expression of Msh2, Msh6 and Ogg1 transcripts in whole lungs from wildtype and CLU−/− knockout mice, 28 days after bleomycin instillation and compared to relevant saline controls. (T–V) ELISAs were performed to measure the concentration of p21, IL-1β and KC on whole murine lung tissues. Depicted is the fold change of p21 (T) and the pg/ml of IL-1β (U) and KC (V) protein concentration in the lungs from wildtype and CLU−/− mice, 28 days after saline or bleomycin challenge. n = 8–13 mice/ group. *P ≤ 0.05, **P ≤ 0.01 significance, or as stated. ns = not significant.

