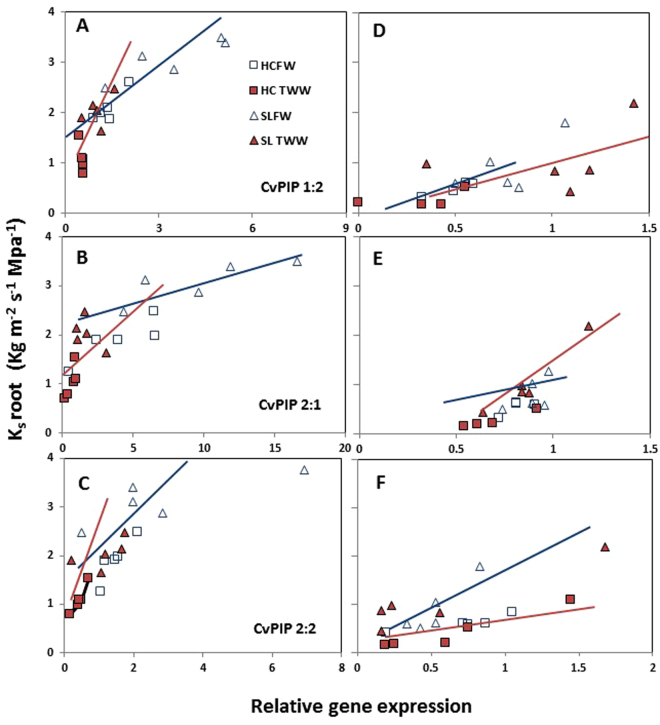
Figure 8.
Relationships between root specific hydraulic conductivity and gene expression (A and D, CvPIP1.2; B and E, CvPIP2.1; C and F, CvPIP2:2) during summer (A–C) and winter (D–F) time, CFW- Clay soil FW, CTWW- Clay soil TWW, SLFW- Sandy Loam FW and SLTWW- Sandy Loam TWW. Values are for each individual replication (n = 4–5). The regression analysis for these three genes shows a significant relation between Ks root and PIPs relative expression (P < 0.01) in both soil types. See correlation value and P in Table S2.

