Fig. 3.
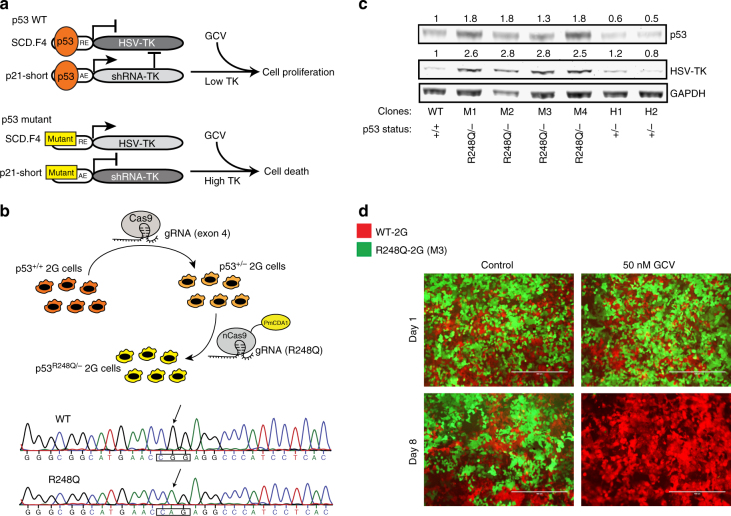
The sensor can discriminate between WT and a hot-spot mutant of p53. a Schematic representation of the effect of WT and mutant p53 on the sensor. b Top; illustration for generating hemizygous (p53R248Q/−) cells. Employed Cas9-proteins and the utilized gRNAs are shown. Bottom; electropherogram confirming the R248Q mutation in hemizygous (p53R248Q/−) cells. c Western blot depicting upregulation of HSV-TK in four different clones harboring the R248Q mutation. The relative quantification to GAPDH of HSV-TK and p53 band signals is shown. d Representative images of the two-color assay in which a mix of WT-2G (m-Cherry-tagged) and R248Q-2G mutant cells (M3 clone; GFP-tagged) was either treated with 50 nM GCV or control (water) for indicated period of time. Scale bars represent 400 μm

