Fig. 4.
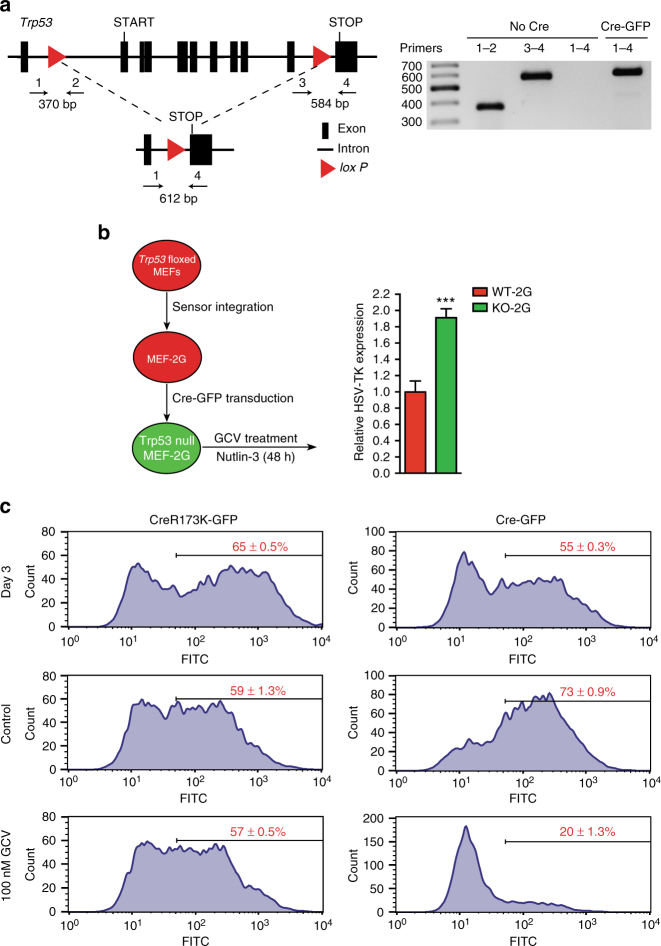
The sensor discriminates p53 WT from p53 KO cells in primary embryonic fibroblasts. a Left; schematic representation of the floxed Trp53 allele in MEFs. Primers used for PCR are depicted. Right; agarose gel electrophoretogram depicts PCR products employing indicated primers in the presence (Cre-GFP) or absence (No Cre) of Cre recombinase. b Left; outline of the experiment in which the 2G sensor was integrated into Trp53 floxed MEFs and then transduced with Cre-GFP expressing retrovirus (or an inactive version of Cre). The bar plot on the right shows relative HSV-TK expression in GFP-positive cells (p53 KO, green) and GFP-negative cells (p53 WT, red) in the presence of 5 μM Nutlin-3. All error bars represent SD of three independent experiments and Student’s two-tailed t-test values are given (***P < 0.001). c FACS histograms depicting the distribution of GFP intensity three days post transduction (top row), and after 6 days of additional control treatment (middle row) or GCV treatment (bottom row) for cells transduced with Cre virus (right) or the inactive recombinase (left). Mean percentages of GFP-positive cells of three replicates are shown

