Fig. 5.
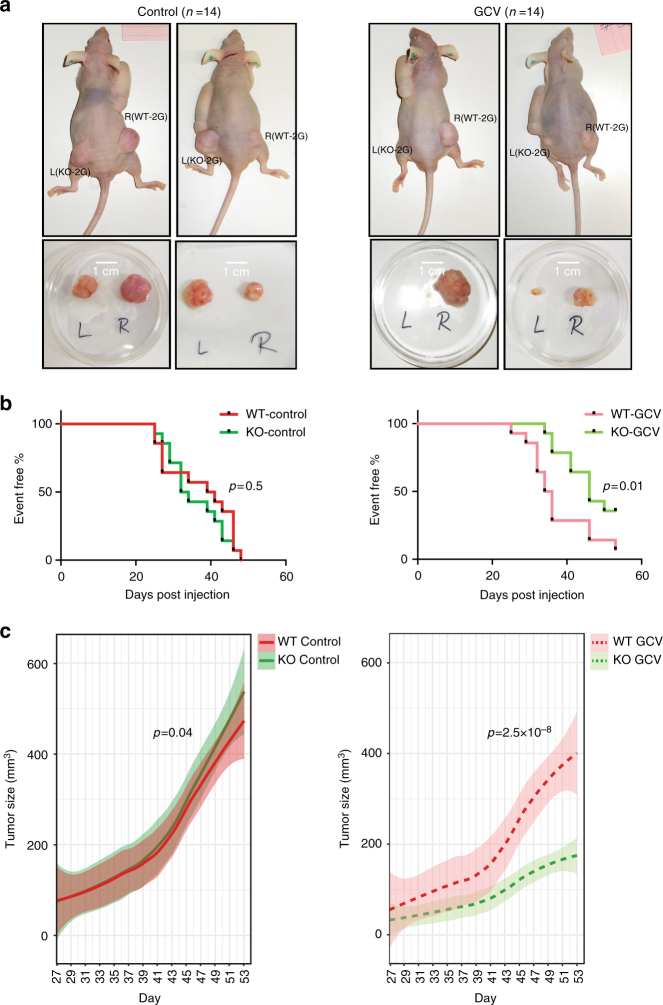
GCV specifically targets KO-2G tumors in vivo. a Top; representative in vivo images of WT-2G (right flank) and KO-2G (left flank) tumors 77 and 56 days post injection in control treatment group (water; left), and 86 and 82 days post injection in GCV-treated (right) mice. Bottom; ex vivo images of WT-2G and KO-2G tumors taken from the corresponding mice. b Kaplan–Meier graphs showing the proportion of mice without palpable tumors (set volume of 100 mm3) as a function of post-injection time (in days) for mice in control (left) and GCV-tretaed (right) groups. p-values comparing time to palpability between WT-2G and KO-2G tumors are shown. c Average tumor volume of WT-2G and KO-2G tumors is given as a function of post-injection time (in days) for control group of mice (n = 14, the left panel), and GCV treatment group (n = 14, the right panel). The curves show results of loess regressions of tumor sizes over time (span = 0.75) and the semi-transparent ribbons indicate 0.95 confidence intervals around the smooth. Indicated p-values are results of likelihood ratio tests comparing linear mixed effects models to respective nested models without an effect of cell type on tumor size

