Figure 6.
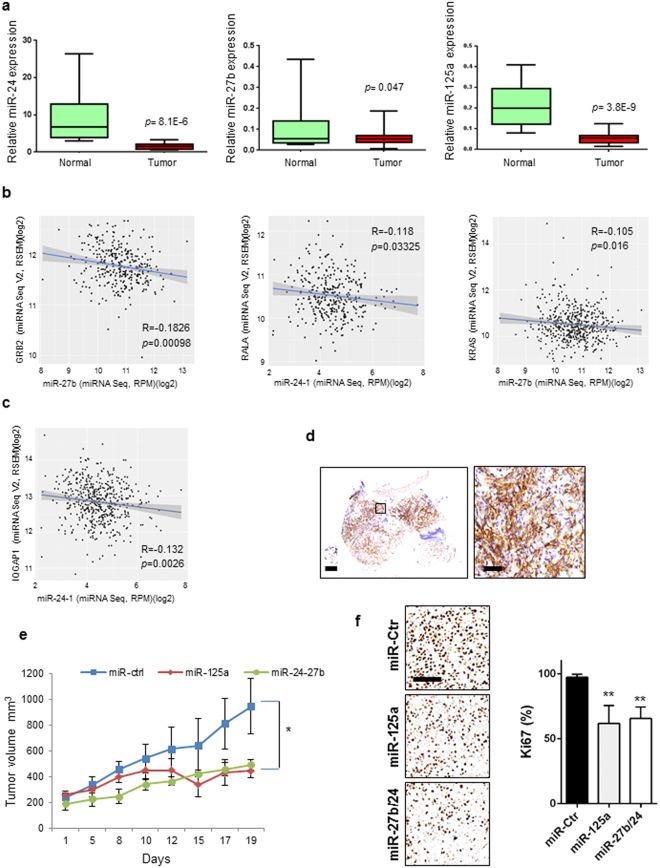
Effect of miR-23b cluster and miR-125a-5p on lung tumorigenesis in vivo. (a) Box plots showing relative expression of mature miR-24, miR-27b and miR-125a-5p expression in 24 normal lung or 24 lung tumour tissues. (b,c) Scatter plots showing inverse correlation between miRNA and respective target gene in 323 (GRB2/miR-27b and miR-24-1/RALA) or 513 (miR-27b/KRAS and miR-24-1/IQGAP1) patients with NSCLC from the Cancer Genome Atlas (TCGA) data set LUAD (lung adenocarcinoma). (d) Representative images of CDX sections showing strong expression of PDGFR-β in cancer cells (Original magnifications: left panel 2x, right panel 8x of left panel insert; scale bars 250 µm). (e) Tumour volume of cohorts of CDX mice treated with a control miR (Ctr), miR-125a-5p or miR-27b/24. (f) Representative images of Ki67 expression in CDX tumors treated with control miR versus miR-125a-5p or miR-27b/24. (Original magnifications: 20x; scale bar 100 µm). Average Ki67 evaluation in the three groups (Ctr vs miR-125a: p < 0.001; Ctr vs miR-27b/24: p < 0.001). Error bars indicate mean ± SD and p values were calculated by two-tailed Student t test (*p < 0.05, **p < 0.001). r = Pearson correlation coefficient.

