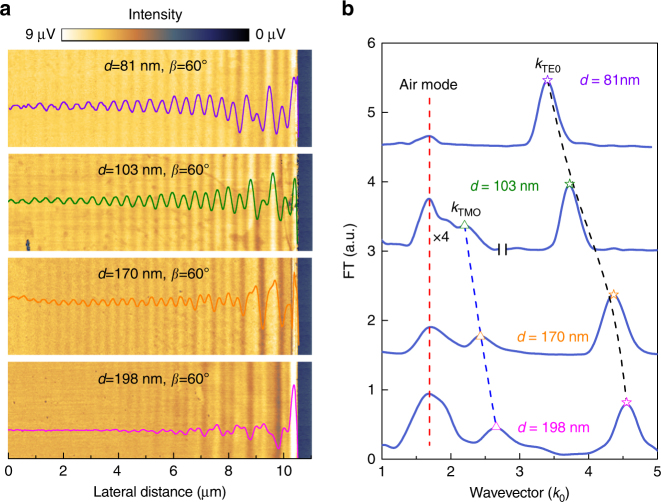
Fig. 2.
Experimental results. a Near-field images and real-space fringe profiles of MoS2 samples with different thicknesses. b Momentum–space spectra of fringe profiles in a. In the experiments, the MoS2 nanoflakes are all placed in the same orientation as in Fig. 1a. The low-frequency peaks in b showing no thickness dependence are the trivial air modes. Note that in b the left part of the second spectrum (d = 103 nm) is multiplied by four

