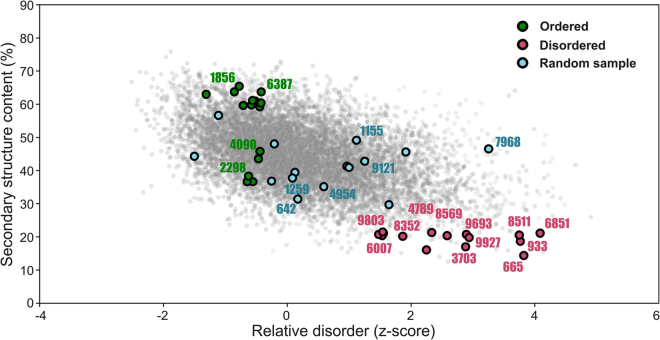
Figure 2.
Selection of sequences from the random dataset for experimental characterization. Scatter plot of the secondary structure (y-axis) and disorder prediction (x-axis) in which the selection of group 1 (green), 2 (blue), and 3 (red) proteins for experimental sampling is highlighted as circles (circles with 4-digit codes assigned were successfully purified and characterized). The secondary structure prediction is based on the overall average structure content stemming from five different predictors. The final disorder score is based on the z-value of the average rank of individual sequences from four different disorder predictors.

