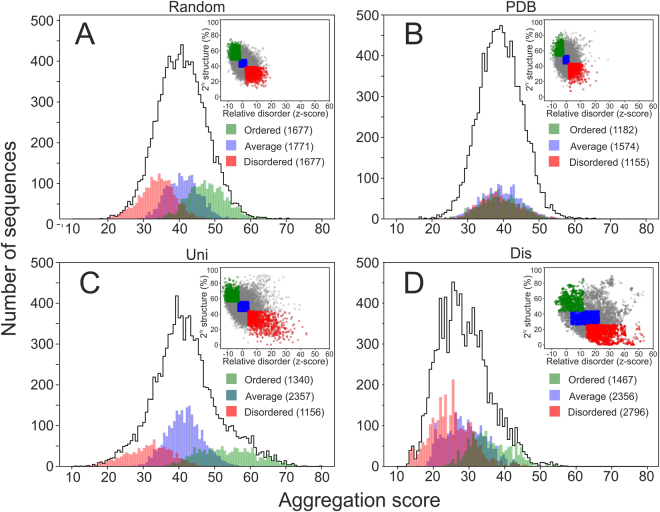
Figure 6.
Aggregation propensity of the datasets depending on secondary structure analysis. Distributions of aggregation propensities for the entire random (A), PDB (B), Uni (C) and Dis (D) datasets showing the “ordered”, “average” and “disordered” subsets (<0.5 SD value, SD ± 0.5 SD, and >0.5 SD values, respectively, from mean values of predicted disorder and secondary structure). The top right corners graphically demonstrate the “ordered”, “average” and “disordered” selections from the secondary structure predictions (y-axis, total % of secondary structure content) and disorder (x-axis, z-score units) – equivalent to Fig. 2. Values in brackets for individual subsets in the legend indicate the population numbers.

