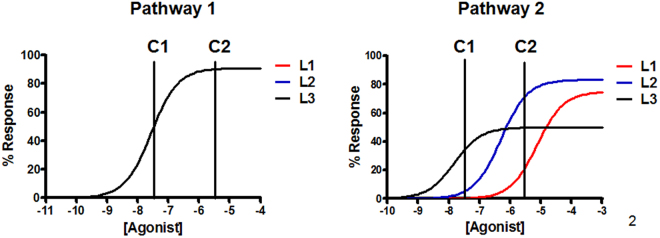
Figure 1.
A theoretical example of receptor activation through two different pathways. In the panel on the left it is represented the concentration-response curve of three agonists for a given receptor acting through Pathway 1. In the panel on the right, concentration-response curves are represented for the same agonists acting through Pathway 2. For the sake of clarity, the three agonists show the same effect in Pathway 1 while different behaviors are exerted through Pathway 2. Concentration is the key: Two concentrations are marked (C1 and C2). For both concentrations and in pathway 1, all three ligands show the same response. In pathway 2, differences appear. At concentration C1 the effect observed for agonist 3 is larger than that observed with the two other ligands. However, at concentration C2, the effect of agonist 3 remains greater than that of agonist 1 but smaller than that observed for agonist 2.

