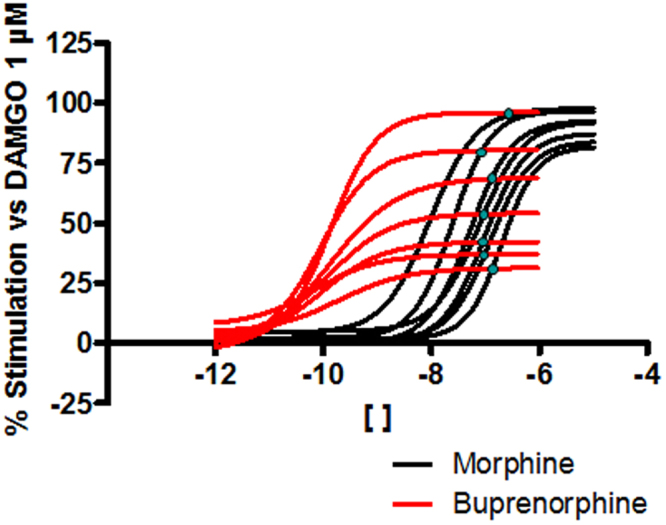
Figure 6.

μ-opioid agonist inhibition of forskolin-stimulated cAMP production assay. The concentration-response curves for morphine and buprenorphine determined in both the absence and presence (1, 3, 10, 30, 100, 300 nM) of the irreversible antagonist β-funaltrexamine are represented jointly in the same graph. The concentrations at which the curves for each agonist cross with each other are marked. Results were obtained in at least three independent experiments. In each experiment, data points were obtained in quadruplicates.
