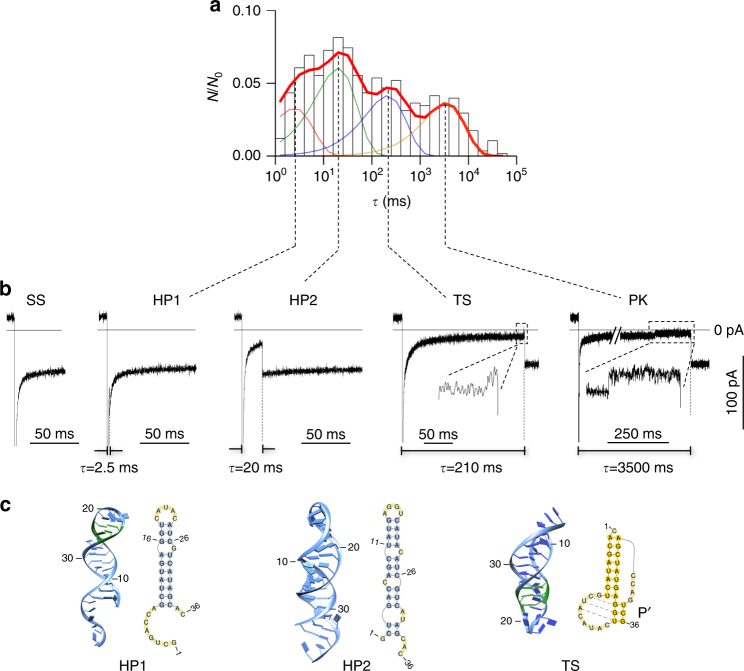
Fig. 3.
Detection of intermediate folding states. a Histogram showing the distribution of unfolding durations of various folding states (N 0 = 578). The x-axis is the time with bin width in the log scale. The y-axis is N 0/N, where N 0 is the total number of events in the histogram and N is the number of events within each bin (log time). N/N 0 represents the fractional population for each bin, and the sum of N/N 0 for all bins, i.e., the area of the histogram, is normalized to “1”. After fitting, the area covered by each component is the fractional population of the corresponding structure (Fig. 4). In this histogram, the unfolding duration of each RNA event was determined under the +120 mV/t fold = 10 s/−60 mV protocol. Four components at 2.5 ms, 20 ms, 210 ms, and 3500 ms were identified in the distribution (Methods). Each component corresponds to a folding state. b Representative nanopore current signatures for the four folding states identified from the unfolding duration distribution in panel a. The longest component (3500 ms) is for the pseudoknot (PK). The 2.5 ms, 20 ms, and 210 ms components are intermediate states. The two insets clearly show the two-level conductance patterns, TS and PK, which are distinct from the single-level patterns for the other intermediate states, HP1 and HP2. In addition, the signature of the open pore current (without block) for single-stranded RNA (SS) is shown. c Structures observed in the simulation that correspond to the three intermediate folding states identified in the nanopore experiment, HP1 (2.5 ms), HP2 (20 ms), and TS (210 ms). 2D and 3D structures for the three intermediates were found in the CG MD simulation. Three non-native base pairs in HP1 and the misfolded stem Pʹ in TS are labeled in green

