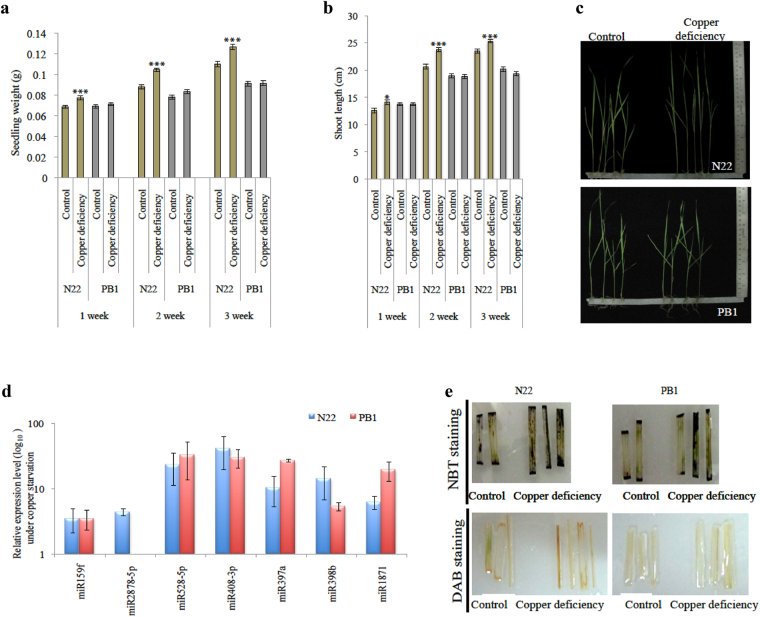
Figure 4.
Copper starvation response of rice cultivars. (a–b) Comparison of weight and length of N22 and PB1 seedlings under control and copper deficient condition. The error bars represent the standard error (n = 30). The asterisks indicate a significant difference between the indicated samples calculated by two tailed students t-test {P ≤ 0.05 (*), P ≤ 0.005 (**), P ≤ 0.001 (***)}. (c) Images of the seedlings grown under control and copper starvation conditions. (d) Relative expression profiling of DTA-miRNAs in rice seedlings under copper deficiency administered at seedling stage. 5 S was used to normalize the miRNA transcript level. Five biological replicates were analyzed with three technical repeats. Error bars represent the standard error. The expression of miR2878-5p was not detected in the PB1 seedlings. (e) Effect of copper starvation on the accumulation of ROS species (superoxide radical with NBT stain and hydrogen peroxide with DAB stain) in the leaves of N22 and PB1 seedlings.

