
Figure 2.
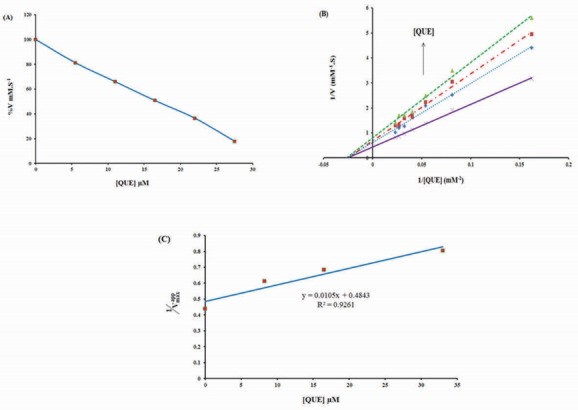
Effect of different concentrations of quercetin (0, 5.5, 11, 16.5, 22 and 27.5 µM) on the catalytic activity of bovine liver catalase in phosphate buffer 50 mM, pH 7, at room temperature. (B) Lineweaver-Burk curve of bovine liver catalase (3 nm) in the absence and presence of different concentrations of quercetin: 0 (×), 8.38 (♦), 16.76 (■) and 33.52 (▲) µM in phosphate buffer 50 mM, pH 7, at room temperature. (C) The secondary linear plot which derived of Lineweaver–Burk plot.