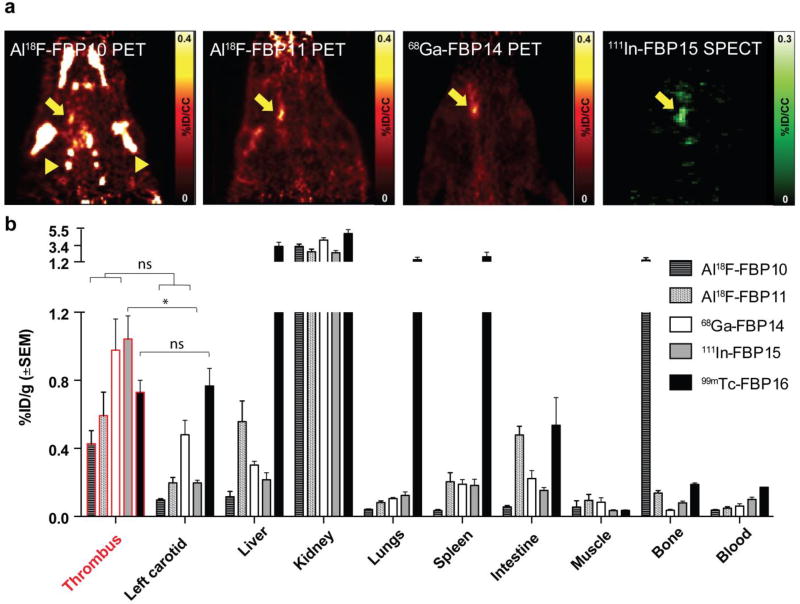
Figure 14.
In vivo evaluation of the Al18F-FBP10, Al18F-FBP11, 68Ga-FBP14, and 111In-FBP15 probes. a. PET images 30–90 min after injection of Al18F-FBP10, Al18F-FBP11, 68Ga-FBP14, and 111In-FBP15 (n = 3 for Al18F-FBP10 and 6 – 8 for other probes). b. Biodistribution at 120 min (n = 3 – 8). Arrow denotes thrombus and arrowhead bone accumulation. (*P < 0.05, ns = not significant, 1-way ANOVA followed by Tukey post hoc test)

