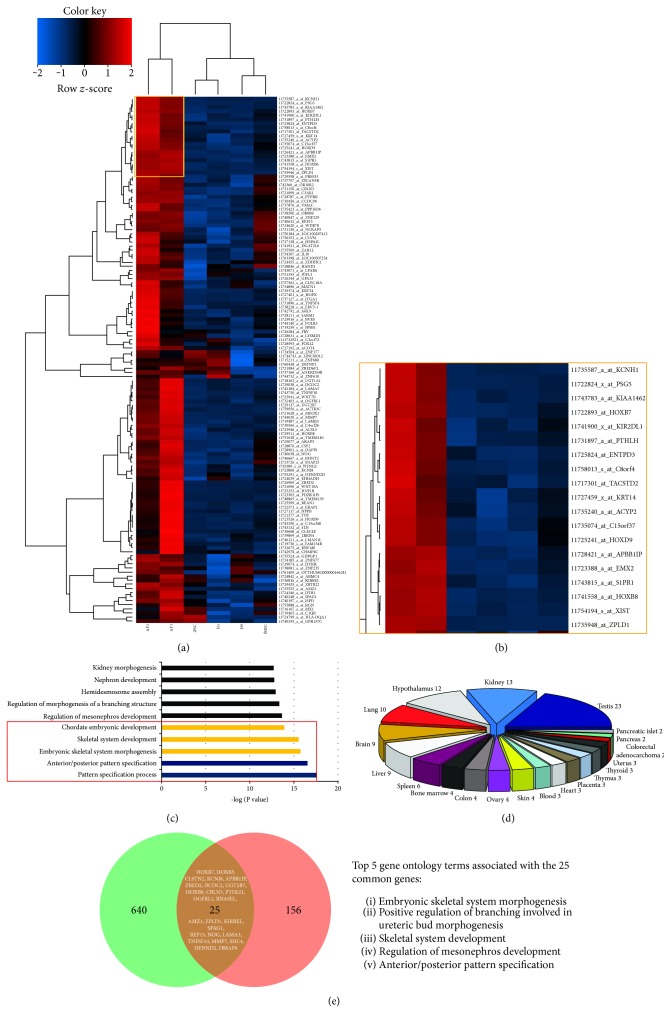
Figure 6.
AF-MSC-specific genes. (a) Heatmap and clustering of the 181 genes exclusive for AF-MSCs (see Figure 5(c)). Zoom in on one cluster of the heatmap (b) showed possible AF-MSC markers (yellow box). Gene ontology (GO) analysis of the 181 AF-MSC exclusive genes using the DAVID tool for the GO terms associated with biological processes (c) with a maximum p value of 0.05. Significantly enriched GO terms for each category are shown with the −log of their p values. (d) Tissue distribution of the 181 exclusive AF-MSC-related genes. (e) Comparative analysis of 181 AF-MSC-specific genes and an already published data set of 665 AFSC-specific genes [11] via Venn diagram uncovered a common set of 25 genes.

