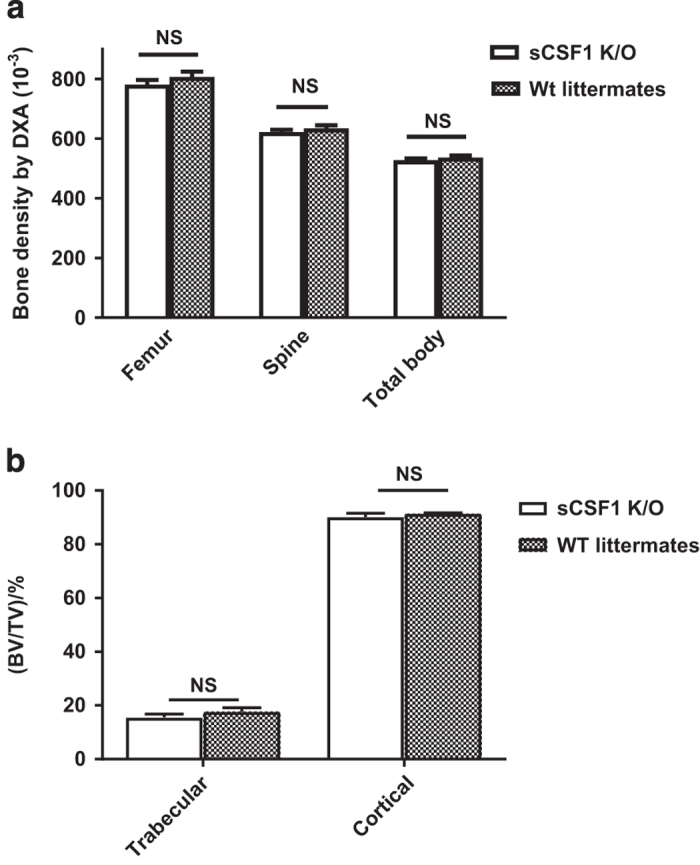
Figure 3.

sCSF1 K/O mice have normal bone density. (a) Femur, spine, and total-body BMD determined by DXA in 37 Wt (17 male and 20 female) and 48 K/O (19 male and 29 female) mice. (b) Femoral trabecular and cortical bone mass assessed by micro-CT in sCSF1 K/O animals (10 male and 10 female animals of each genotype). Results are expressed as M±s.e.m. and analyzed by two-way ANOVA for the data in a and by Mann–Whitney for the data in b. ANOVA, analysis of variance; BMD, bone mineral density; DXA, dual-energy X-ray absorptiometry; K/O, knockout; M, mean; NS, not significant; Wt, wild type.
