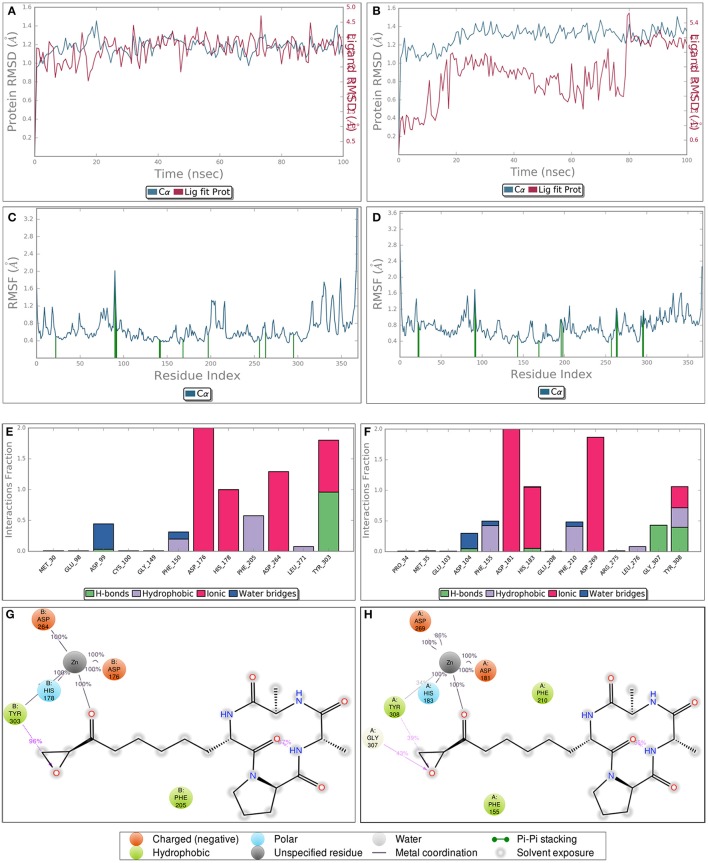
Figure 7.
Diagrams obtained after performing molecular dynamics simulation of HC-toxin-HDAC1 and HC-toxin-HDAC2 docked complexes for around 100 ns. While (A,B) indicate the RMSF of HDAC1 and HDAC2 in docked state with HC-toxin, (C,D) represent the RMSF of the defined HDACs in bound state with the HC-toxin. Different types of interactions between HC-toxin and the two HDACs. (E,G) represent interaction profile of HC-toxin-HDAC1; (F,H) represent same profile for HC-toxin-HDAC2. Consider interactions made by HC-toxin with receptor which includes both HDAC1 and HDAC2 and their cofactor Zn.

