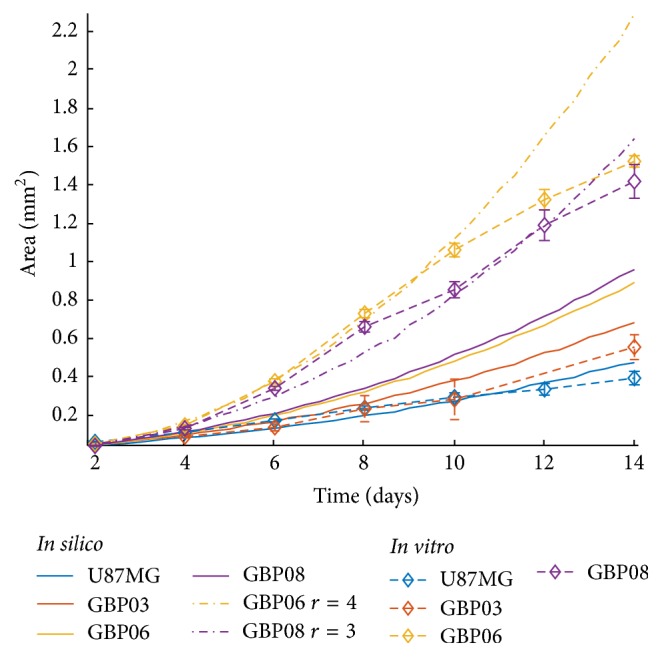
Figure 7.

In vitro spheroidal growth as opposed to in silico for all four cell types with the final chosen sets of doubling times as shown in Table 1 and fixed proliferation depth equal to 2. Two additional simulated growth curves are depicted with different proliferation depth values for the GBP06 (r = 4, yellow dash dotted line) and the GBP08 (r = 3, purple dash dotted line) spheroids.
