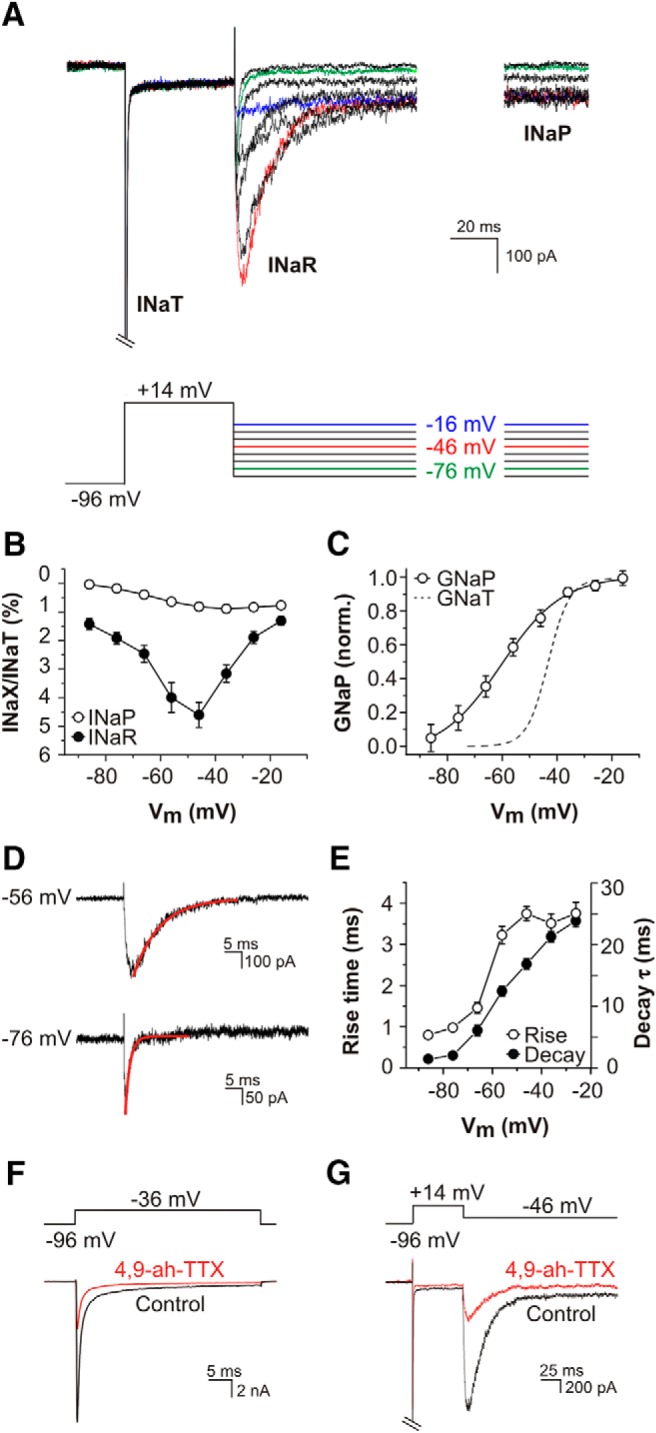
Figure 3.

Kinetics, voltage dependence, and pharmacology of resurgent and persistent Na+ currents in SGNs. A, Family of TTX-sensitive difference currents evoked by 50-ms step depolarization to +14 mV, followed by 200-ms step repolarization to potentials between −16 and −86 mV. Steps to particular potentials are denoted by the colored traces in the voltage protocol. INaT was activated during the steps to +14 mV (cropped for clarity). INaR activated rapidly on repolarization and then decayed, revealing the noninactivating INaP at the end of the test steps. B, Current−voltage (I-V) relationships for maximum TTX-sensitive INaR (filled circles) and steady-state INaP (open circles; measured between 160 and 190 ms after the onset of the repolarization steps). INaR and INaP are shown as a percentage of maximum INaT recorded in the same cell (n = 30; P12-P14). C, Normalized steady-state conductance-voltage plot for the channels underlying INaP (open circles), fitted with a Boltzmann function (n = 23; P12-P14). For comparison, the peak conductance-voltage plot for INaT is also shown (discontinuous line, from Fig. 2B). D, The kinetics of activation and decay of INaR varied with repolarization potential. During the protocol used in A, repolarization to −76 mV elicited a current with shorter rise time and decay (exponential fit overlaid in red) compared to that elicited by repolarization to −56 mV. E, Mean onset (time to peak) and offset (decay time constant) kinetics of INaR in 19 SGNs (P12-P14). F, G, 4,9-ah-TTX, a toxin specific for Nav1.6 subunits blocks INaT, INaR and INaP. F, A depolarizing voltage step to −36 mV activated INaT (black trace), which was blocked >70% by bath applied 100 nM 4,9-ah-TTX (red). G, A repolarization from +14 to −46 mV activated INaR and INaP (black trace), which were both blocked ∼70% by bath applied 100 nM 4,9-ah-TTX (red).
