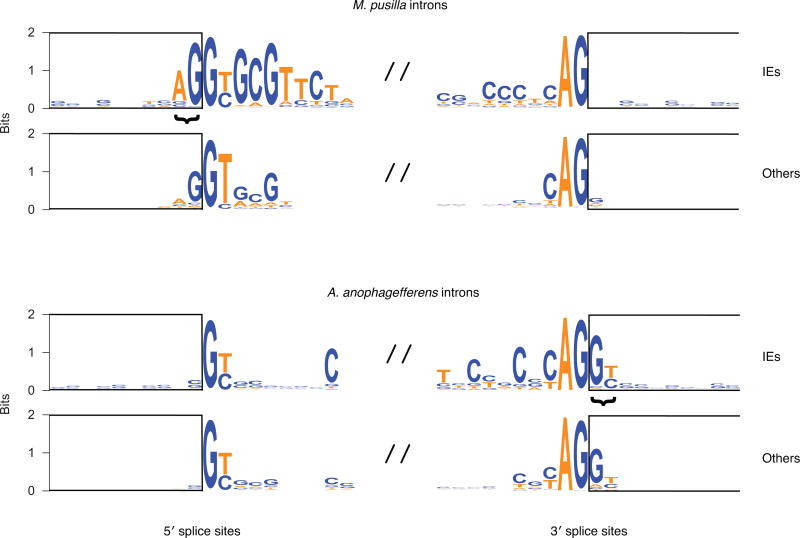
Extended Data Figure 7. Splice site sequences.
Logos for the 10 bp upstream and downstream of 5′ and 3′ splice sites for IE and other introns are shown for each organism. The rectangles show exonic positions. The core splice sites are GY (Y is C or T) and AG, respectively. IEs combined with co-opted exonic sequence that is duplicated (Fig. 3) to generate particular sequences that extend beyond the core sites (bracketed). Specifically, this results in a predominance of AG|GY sequences (“|” denotes the position of splicing that ultimately occurs) at 5′ splice sites in M. pusilla IE introns and 3′ splice sites in A. anophagefferens IE introns. Similar respective sequences are observed in other introns in each organism: G|GT for M. pusilla 5′ splice sites and AG|G for A. anophagefferens 3′ splice sites. In non-IE introns, these sequences have been under selection for long periods of time to promote RNA splicing, revealing the sequences extending beyond core sites that probably contribute to optimal splicing in each organism. The similarity of IE intron splice sites to other inton splice sites thus suggests that IEs in each organism generate new introns that are spliced reasonably well.

