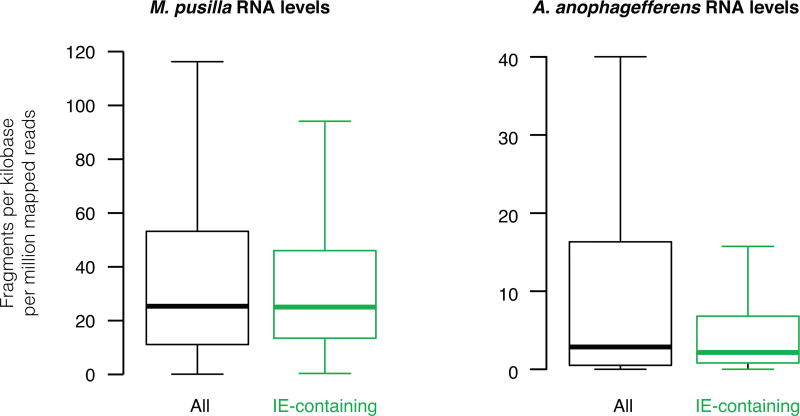
Extended Data Figure 8. Most IEs are located in genes expressing low to average RNA levels.
Distributions of detectable RNA levels of all transcripts (black) and only those containing at least 1 IE (green) are shown as measured by RNA sequencing. Box plots indicate the median, 1st and 3rd quartiles with whiskers extending up to data 1.5 times the interquartile range away from the box. For M. pusilla, IE-containing gene expression does not significantly differ from that of all genes, P=0.59. For A. anophagefferens, IE-containing gene expression is slightly lower than that of all genes, P=0.041.

