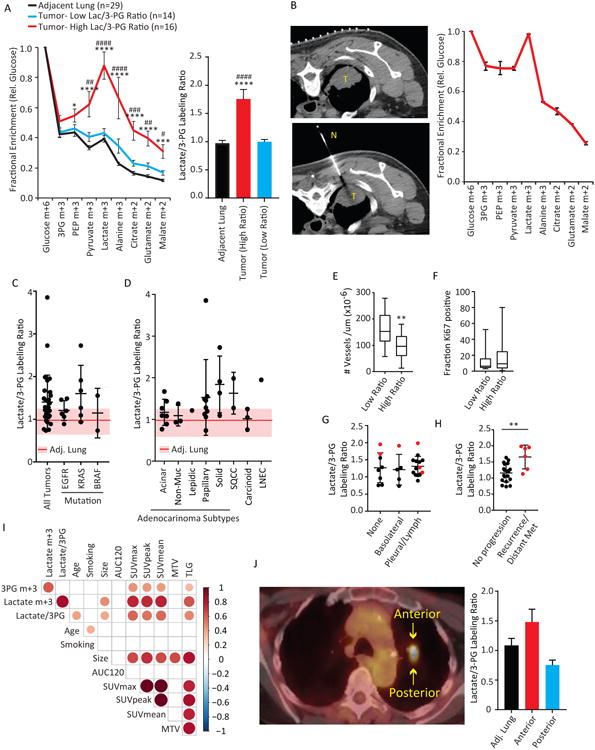
Figure 1. Human tumors display heterogeneous patterns of 13C labeling in vivo.

(A) 13C enrichments in adjacent lung (black, n=29), Low ratio tumors (blue, n=14) and High ratiotumors (red, n=16). Fractional enrichments of glycolytic and TCA cycle metabolites arenormalized to enrichment of glucose in the tissue. Lactate/3PG labeling ratios are summarized inthe graph to the right. Average values and S.E.M. are displayed. For High ratio vs. Adjacent Lung:**** p< 0.0001; *** p<0.001; *p<0.05. For High Ratio vs. Low Ratio: #### p< 0.0001; ###p<0.001; ## p<0.01; #p<0.05 (Left, Two-way ANOVA, Tukey post-hoc; Right, one-way ANOVA,Tukey post-hoc).
(B) Left: Computed tomography-guided biopsy of a human NSCLC before (top) and during (bottom)the biopsy. Right: Mass isotopologues from the tumor. Error bars represent S.D. of threetechnical replicates.
(C) Lactate/3PG labeling ratio in tumors of various oncogenotypes (n=30). The shaded regionindicates the mean (line) and S.E.M. of benign lung samples (n=29).
(D) Lactate/3PG labeling ratios in tumors of various histological types (n=30). The shaded regionindicates the mean (line) and S.E.M. of benign lung samples (n=29).
(E) Microvessel density (MVD) (n=12 per group). ** p<0.01 (Students t-test).
(F) Ki67 content by MIB1 staining (n=12 low; n=14 high).
(G) Lactate/3PG labeling ratios in Stage 1 or 2 tumors of various levels of invasiveness at time of infusion (n=25). Pleural/lymph indicates tumors with spread to the pleural cavity or regional lymph nodes. Tumors that recurred or developed distant metastases in the years after the infusions are in red.
(H) Lactate/3PG labeling ratios of Stage 1 or 2 tumors that progressed (distant metastasis or recurrence in the lung) or did not progress during the study. ** p<0.01 (Student's t-test).
(I) Correlation analysis of clinical and metabolic features. Each circle denotes a statistically significant (p<0.05) correlation, with size and color scaling with level of significance. Smoking was measured in pack-years (i.e. average number of packs per day x number of years smoking).
(J) Left: Axial view of patient K1051's FDG-PET scan. Regions of differing FDG-PET signal were sampled. Right: Labeling ratios from three regions of K1051's resection. Data are average and S.D. of three small fragments obtained from each site.
Abbreviations: 3PG, 3-phosphoglycerate; PEP, phosphoenolpyruvate; AUC120, area under the relative contrast enhancement curve after 120 seconds during dynamic contrast-enhanced MRI; SUV, standardized uptake value; MTV, metabolic tumor volume; TLG, total lesion glycolysis. T, tumor; N, needle.
