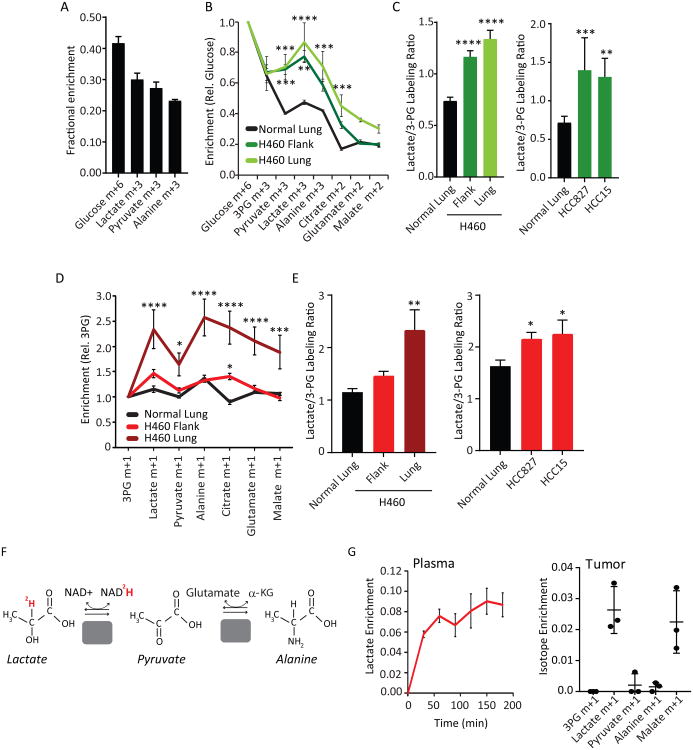
Figure 4. Lactate is a fuel in mouse NSCLC xenografts.
(A) Plasma metabolite enrichment in mice infused with [U-13C]glucose. Data are average and S.E.M.(n=6 mice).
(B) Tissue metabolite enrichment in H460 tumor-bearing mice infused with [U-13C]glucose.Enrichments in normal lung, flank tumor and lung tumor are normalized to glucose enrichmentin each tissue. Data are average and S.E.M. **** p< 0.0001, *** p< 0.001, ** p< 0.01, (Two-wayANOVA, Tukey post-hoc) (n=3-4 mice per group).
(C) Left: Lactate/3PG labeling ratios of tissues from (B). Right: Mice bearing HCC827 and HCC15flank xenografts were infused as in (B). Lactate/3PG labeling ratios are displayed as average andS.E.M. The Lactate/3PG labeling ratio of HCC15 tumors are derived from Vector control tumorsin Fig. 5F. **** p< 0.0001, *** p< 0.001, ** p< 0.01 (One-way ANOVA, Dunnett post-hoc vs.Adjacent lung; n=5-6 mice per group).
(D) Mice bearing H460 tumors in the flank or lung were infused with [3-13C]lactate. Enrichmentvalues are relative to 3PG. Data are average and S.E.M. ****p< 0.0001, ***p<0.001, *p<0.05 vs.adjacent lung. (Two-way ANOVA, Tukey post-hoc; n=4-5 mice per group).
(E) Left: Lactate/3PG labeling ratios of tissues in (D). Right: Mice bearing HCC827 and HCC15 flank xenografts were infused as in (D). Data are average and S.E.M. ** p<0.01, * p< 0.05 (One-way ANOVA, Dunnett post-hoc vs. 3PG; n=4-5 mice per group). The Lac/3PG ratio of the HCC15 mice is derived from the vector control tumors in panel 5E.
(F) Schematic of [2-2H]lactate metabolism.
(G) Plasma and tumor metabolite enrichments in mice infused with [2-2H]lactate. Data are average and S.D. (n=3 mice).

