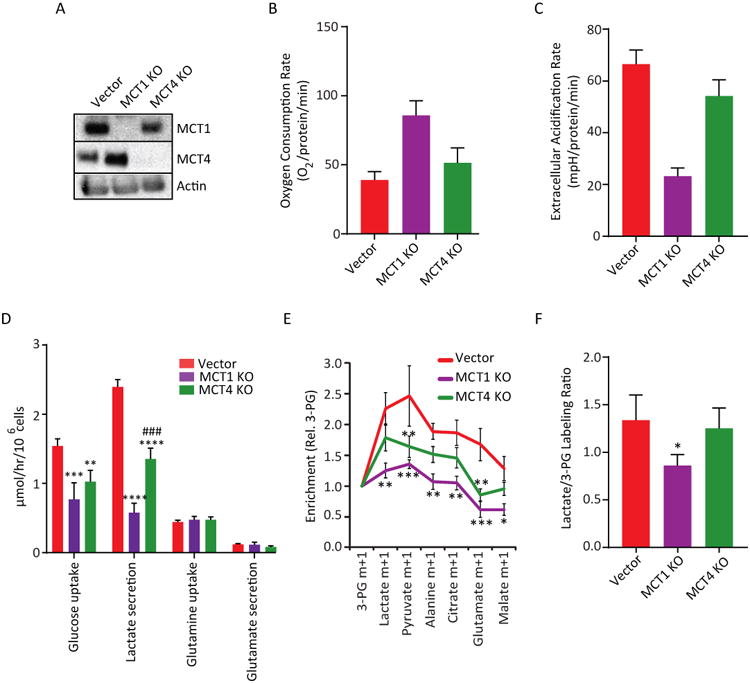
Figure 5. MCT1 regulates lactate uptake in HCC15 xenografts.

(A) Immunoblot of HCC15 cells expressing a control vector or CRISPR-mediated knockoutof MCT1 or MCT4. Actin is used as a loading control.
(B,C) Oxygen consumption and extracellular acidification rates in Control, MCT1 KO and MCT4 KOcells. Data are average ± SD from a representative experiment (n= 6).
(D) Metabolic rates from cultures of Vector control HCC15 cells and sub-lines with knockout of MCT1 or MCT4. **** p< 0.0001; *** p<0.001, **p<0.01 vs. Vector. ### p<0.001 vs MCT1 KO(Two-way ANOVA, Tukey post-hoc, n=3 separate experiments).
(E) Mice bearing HCC15 Vector control, MCT1 KO, or MCT4 KO tumors were infused with [2-13C]lactate. Enrichment values are normalized to 3PG. *** p< 0.001, ** p< 0.01, *p<0.05. (Two-way ANOVA, Tukey post-hoc; n=3-4 mice per group).
(F) Mice bearing HCC15 Vector control, MCT1 KO, or MCT4 KO tumors were infused with [U-13C]glucose. The Lactate/3PG labeling ratio is plotted for each tumor type. Data are average andS.EM. * p< 0.05 (One-way ANOVA, Tukey post-hoc; n=3-5 mice per group).
