
Fig. 5.
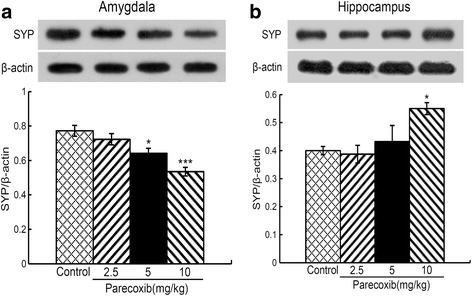
Effects of chronic administration of parecoxib on synaptophysin protein expression in the amygdala and hippocampus. The protein band (top) and the relative expression levels of synaptophysin (down) in the amygdala (a) and hippocampus (b). *P < 0.05 and ***P < 0.001 versus the control group. SYP, synaptophysin; All data are represented as mean ± SEM