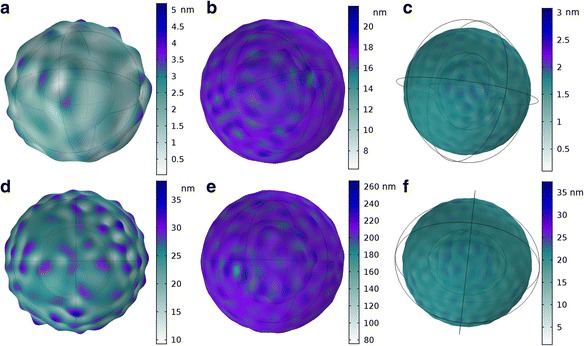
Fig. 2.

Ultrasound induced cellular deformation, the color represents displacement in nanometers. The frequency and pressure amplitude was varied a) 1 MHz; 14 kPa, b) 5 MHz; 14 kPa, c) 6.5 MHz; 14 kPa, d) 1 MHz; 170 kPa, e) 5 MHz; 170 kPa, f) 6.5 MHz; 170 kPa. (The knobby appearances in A and D are exaggerated to visually see the displacement. The displacement magnitude is depicted by color and is not depicted to scale in the figures)
